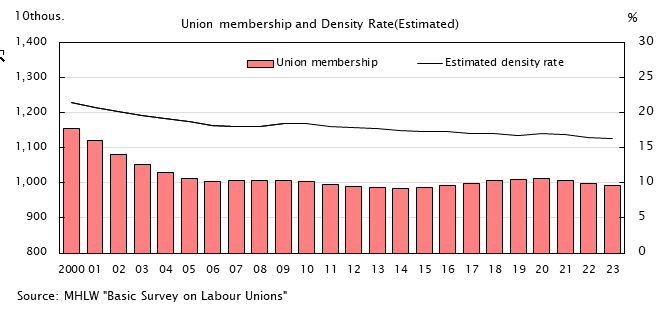
Industrial Relations
| Union membership |
Estimated Density Rate |
Estimated Density Rate (by size of establishment) | |||
|---|---|---|---|---|---|
| Private enterprises | |||||
| 1000 employees and over |
100-999 employees |
1-99 employees | |||
| Calendar year | persons | % | % | % | % |
| 2000 | 11,538,557 | 21.5 | 54.2 | 18.8 | 1.4 |
| 2001 | 11,212,108 | 20.7 | 53.5 | 17.7 | 1.3 |
| 2002 | 10,800,608 | 20.2 | 54.8 | 16.8 | 1.3 |
| 2003 | 10,531,329 | 19.6 | 51.9 | 16.6 | 1.2 |
| 2004 | 10,309,413 | 19.2 | 50.6 | 15.8 | 1.2 |
| 2005 | 10,138,150 | 18.7 | 47.7 | 15.0 | 1.2 |
| 2006 | 10,040,580 | 18.2 | 46.7 | 14.8 | 1.1 |
| 2007 | 10,079,614 | 18.1 | 47.5 | 14.3 | 1.1 |
| 2008 | 10,064,823 | 18.1 | 45.3 | 13.9 | 1.1 |
| 2009 | 10,077,506 | 18.5 | 46.2 | 14.2 | 1.1 |
| 2010 | 10,053,624 | 18.5 | 46.6 | 14.2 | 1.1 |
| 2011 | 9,960,609 | 18.1 | - | - | - |
| 2012 | 9,892,284 | 17.9 | 45.8 | 13.3 | 1.0 |
| 2013 | 9,874,895 | 17.7 | 44.9 | 13.1 | 1.0 |
| 2014 | 9,849,176 | 17.5 | 45.3 | 12.4 | 1.0 |
| 2015 | 9,882,092 | 17.4 | 45.7 | 12.2 | 0.9 |
| 2016 | 9,940,495 | 17.3 | 44.3 | 12.2 | 0.9 |
| 2017 | 9,981,437 | 17.1 | 44.3 | 11.8 | 0.9 |
| 2018 | 10,069,711 | 17.0 | 41.5 | 11.7 | 0.9 |
| 2019 | 10,087,915 | 16.7 | 40.8 | 11.4 | 0.8 |
| 2020 | 10,115,447 | 17.1 | 41.8 | 11.3 | 0.9 |
| 2021 | 10,077,877 | 16.9 | 39.2 | 11.1 | 0.8 |
| 2022 | 9,992,373 | 16.5 | 39.6 | 10.5 | 0.8 |
| 2023 | 9,937,654 | 16.3 | 39.8 | 10.2 | 0.8 |
| 2024 | 9,911,671 | 16.1 | 40.0 | 9.9 | 0.7 |
| 2025 | 9,926,971 | 16.0 | 38.7 | 9.9 | 0.7 |
| Source | MHLW "Basic Survey on Labour Unions" | ||||


