Family Income and Expenditure - Consumption Expenditures
| Two-or-more-person Households | ||||||
|---|---|---|---|---|---|---|
| Workers' households | All households | |||||
| Consumption expenditures |
Average propensity to consume |
Consumption expenditures |
||||
| Annual percent change (Nominal) | Annual percent change (Real) | Annual percent change (Real) | ||||
| Calendar year | ¥ | % | % | % | % | |
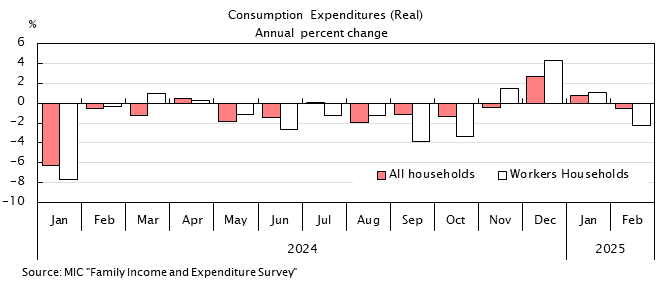
| 2020 | 305,811 | -5.6 | -5.6 | 61.3 | -5.3 | |
| 2021 | 309,469 | 1.2 | 1.5 | 62.8 | 0.7 | |
| 2022 | 320,627 | 3.6 | 0.6 | 64.0 | 1.2 | |
| 2023 | 318,755 | -0.6 | -4.2 | 64.4 | -2.6 | |
| 2024 | 325,137 | 2.0 | -1.2 | 62.2 | -1.1 | |
| 2025 | 346,297 | 6.5 | 2.7 | 65.0 | 0.9 | |
| 2025 | Apr | 363,182 | 5.3 | 1.2 | 76.4 | -0.1 |
| May | 351,466 | 10.3 | 6.1 | 87.6 | 4.7 | |
| Jun | 323,202 | 7.7 | 3.8 | 41.6 | 1.3 | |
| Jul | 338,900 | 8.4 | 4.6 | 60.5 | 1.4 | |
| Aug | 347,325 | 9.0 | 5.7 | 68.6 | 2.3 | |
| Sep | 339,762 | 10.2 | 6.6 | 82.1 | 1.8 | |
| Oct | 338,977 | 3.5 | 0.1 | 67.9 | -3.0 | |
| Nov | 350,349 | 10.7 | 7.2 | 82.3 | 2.9 | |
| Dec | 374,127 | -1.3 | -3.6 | 37.0 | -2.6 | |
| 2026 | Jan | 334,790 | 1.0 | -0.7 | 77.4 | -1.0 |
| Feb | 319,797 | 1.9 | 0.5 | 65.2 | -1.8 | |
| Mar | 374,892 | -2.1 | -3.6 | 82.7 | -2.9 | |
| Apr | 364,781 | 0.4 | -1.1 | 73.9 | -0.5 | |
| May | 353,443 | 0.6 | -1.1 | 86.1 | -0.4 | |
| Source | MIC "Family Income and Expenditure Survey" | |||||