Family Income and Expenditure - Income
| Workers' households(Two-or-more-person) | ||||||
|---|---|---|---|---|---|---|
| Income | Disposable income | |||||
| Annual percent change (Nominal) |
Annual percent change (Nominal) |
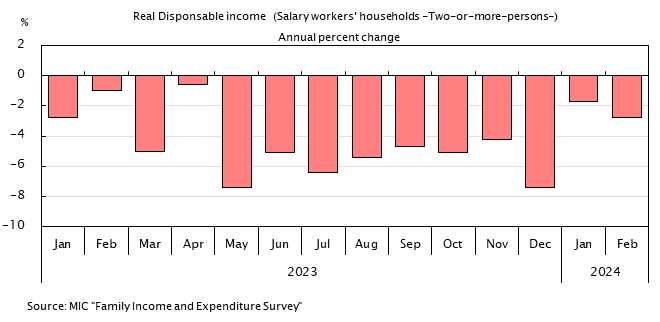
Annual percent change (Real) | ||||
| Calendar year | ¥ | % | ¥ | % | % | |
| 2020 | 609,535 | 4.0 | 498,639 | 4.6 | 4.6 | |
| 2021 | 605,316 | -0.7 | 492,681 | -1.2 | -0.9 | |
| 2022 | 617,654 | 2.0 | 500,914 | 1.7 | -1.3 | |
| 2023 | 608,182 | -1.5 | 494,668 | -1.2 | -4.8 | |
| 2024 | 636,155 | 4.6 | 522,569 | 5.6 | 2.3 | |
| 2025 | 653,901 | 2.8 | 532,408 | 1.9 | -1.7 | |
| 2025 | Apr | 589,528 | 4.1 | 475,520 | 5.0 | 0.9 |
| May | 522,318 | 4.4 | 401,312 | 6.7 | 2.6 | |
| Jun | 976,268 | 2.0 | 776,288 | -4.6 | -8.1 | |
| Jul | 701,283 | 1.0 | 559,705 | -1.5 | -4.9 | |
| Aug | 608,578 | 6.0 | 506,538 | 5.1 | 1.9 | |
| Sep | 510,935 | 3.4 | 413,961 | 2.8 | -0.6 | |
| Oct | 599,845 | 3.3 | 499,170 | 3.0 | -0.4 | |
| Nov | 519,304 | 1.0 | 425,503 | 0.7 | -2.5 | |
| Dec | 1,207,545 | 2.4 | 1,010,407 | 3.6 | 1.2 | |
| 2026 | Jan | 530,520 | 3.0 | 432,712 | 3.0 | 1.3 |
| Feb | 589,038 | 3.0 | 490,520 | 3.4 | 2.0 | |
| Mar | 557,663 | 6.4 | 453,448 | 6.4 | 4.7 | |
| Apr | 612,163 | 3.8 | 493,684 | 3.8 | 2.3 | |
| May | 534,893 | 2.4 | 410,713 | 2.3 | 0.6 | |
| Source | MIC "Family Income and Expenditure Survey" | |||||