Industrial Injuries
| Number of industrial injuries and occupational diseases | ||||
|---|---|---|---|---|
| Deaths | Number of grave accidents | |||
| Annual change |
Annual change | |||
| Calendar year | ||||
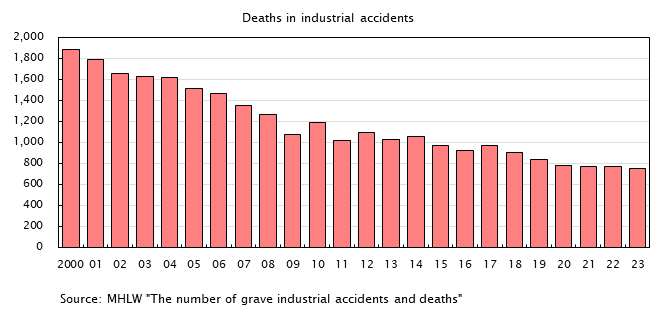
| 2000 | 1,889 | -103 | 230 | 16 |
| 2001 | 1,790 | -99 | 225 | -5 |
| 2002 | 1,658 | -132 | 231 | 6 |
| 2003 | 1,628 | -30 | 249 | 18 |
| 2004 | 1,620 | -8 | 274 | 25 |
| 2005 | 1,514 | -106 | 265 | -9 |
| 2006 | 1,472 | -42 | 318 | 53 |
| 2007 | 1,357 | -115 | 293 | -25 |
| 2008 | 1,268 | -89 | 281 | -12 |
| 2009 | 1,075 | -193 | 228 | -53 |
| 2010 | 1,195 | 120 | 245 | 17 |
| 2011 | 1,024 | -171 | 255 | 10 |
| 2012 | 1,093 | 69 | 284 | 29 |
| 2013 | 1,030 | -63 | 244 | -40 |
| 2014 | 1,057 | 27 | 292 | 48 |
| 2015 | 972 | -85 | 278 | -14 |
| 2016 | 928 | -44 | - | - |
| 2017 | 978 | 50 | - | - |
| 2018 | 909 | -69 | - | - |
| 2019 | 845 | -64 | - | - |
| 2020 | 784 | - | - | - |
| 2021 | 778 | - | - | - |
| 2022 | 774 | -4 | - | - |
| 2023 | 755 | -19 | - | - |
| 2024 | 746 | -9 | - | - |
| Source | MHLW "The number of grave industrial accidents and deaths" | |||