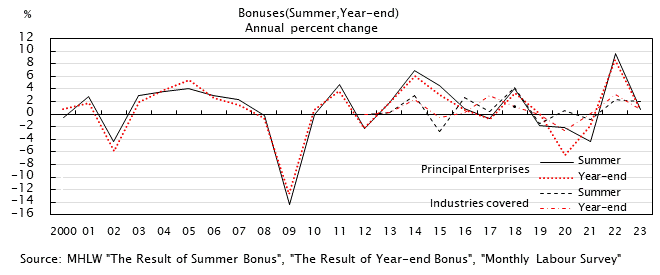
Bonuses
| Summer | Year-end | |||||||
|---|---|---|---|---|---|---|---|---|
| Principal Enterprises |
Industries covered (5 employees or more) |
Principal Enterprises | Industries covered (5 employees or more) |
|||||
| Annual percent change | Annual percent change | Annual percent change | Annual percent change | |||||
| Calendar year | ¥ | % | ¥ | % | ¥ | % | ¥ | % |
| 2000 | 758,804 | -0.54 | 442,921 | - | 799,232 | 0.76 | 471,809 | - |
| 2001 | 783,113 | 2.86 | 438,079 | - | 812,934 | 1.76 | 454,251 | - |
| 2002 | 749,803 | -4.30 | 412,853 | - | 755,551 | -5.88 | 432,261 | - |
| 2003 | 781,930 | 3.00 | 418,818 | - | 771,540 | 1.97 | 428,475 | - |
| 2004 | 810,052 | 3.53 | 406,697 | - | 811,082 | 3.87 | 430,188 | - |
| 2005 | 839,313 | 4.03 | 410,231 | - | 840,516 | 5.39 | 432,312 | - |
| 2006 | 841,817 | 2.94 | 415,437 | - | 841,854 | 2.53 | 432,220 | - |
| 2007 | 843,779 | 2.27 | 406,072 | - | 845,119 | 1.47 | 416,816 | - |
| 2008 | 842,270 | -0.29 | 406,611 | - | 831,813 | -0.63 | 422,313 | - |
| 2009 | 710,844 | -14.33 | 364,191 | - | 726,933 | -12.64 | 381,547 | - |
| 2010 | 711,890 | 0.01 | 368,551 | - | 733,935 | 0.68 | 380,309 | - |
| 2011 | 747,187 | 4.70 | 365,158 | - | 761,294 | 3.64 | 375,747 | - |
| 2012 | 726,345 | -2.33 | 359,974 | - | 739,295 | -2.26 | 368,144 | - |
| 2013 | 746,334 | 1.85 | 362,794 | 0.3 | 761,364 | 1.81 | 370,898 | 0.3 |
| 2014 | 800,653 | 6.97 | 375,260 | 3.0 | 800,638 | 6.02 | 381,409 | 2.4 |
| 2015 | 832,292 | 4.59 | 360,889 | -2.7 | 830,434 | 3.08 | 374,338 | -0.5 |
| 2016 | 843,577 | 0.82 | 370,298 | 2.6 | 830,609 | 0.71 | 375,207 | 0.2 |
| 2017 | 825,150 | -0.62 | 371,600 | 0.4 | 830,625 | -0.78 | 386,614 | 3.0 |
| 2018 | 870,731 | 4.07 | 387,048 | 4.2 | 862,986 | 3.34 | 391,158 | 1.2 |
| 2019 | 845,453 | -1.85 | 381,343 | -1.5 | 868,604 | 0.10 | 390,733 | -0.1 |
| 2020 | 828,171 | -2.14 | 383,439 | 0.5 | 786,460 | -6.54 | 380,481 | -2.6 |
| 2021 | 773,632 | -4.30 | 380,268 | -0.8 | 782,198 | -1.92 | 380,787 | 0.1 |
| 2022 | 832,340 | 9.57 | 389,331 | 2.4 | 842,978 | 8.58 | 392,975 | 3.2 |
| 2023 | 845,557 | 0.72 | 397,129 | 2.0 | 849,545 | 0.86 | 395,647 | 0.7 |
| 2024 | 898,754 | 4.33 | 414,515 | 2.3 | 891,460 | 5.31 | 413,277 | 2.5 |
| 2025 | 946,469 | 6.34 | 426,337 | 2.9 | 957,184 | 3.18 | 424,889 | 2.8 |
| Source | MHLW "The Result of Summer Bonus" |
MHLW "Monthly Labour Survey" |
MHLW "The Result of Year-end Bonus" |
MHLW "Monthly Labour Survey" |
||||