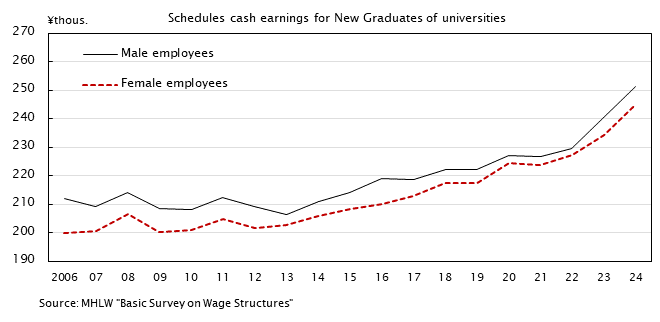
Scheduled cash earnings for new graduates
| Scheduled cash earnings for new graduates | ||||
|---|---|---|---|---|
| Graduates of senior high schools | Graduates of universities | |||
| Male employees | Female employees | Male employees | Female employees | |
| Calendar year | ¥thous. | ¥thous. | ¥thous. | ¥thous. |
| 2006 | 167.3 | 155.2 | 211.9 | 199.8 |
| 2007 | 167.4 | 155.6 | 209.1 | 200.6 |
| 2008 | 169.1 | 160.0 | 214.0 | 206.5 |
| 2009 | 167.7 | 157.7 | 208.6 | 200.4 |
| 2010 | 168.5 | 157.5 | 208.0 | 200.8 |
| 2011 | 167.7 | 155.4 | 212.4 | 204.9 |
| 2012 | 166.9 | 160.2 | 209.3 | 201.7 |
| 2013 | 163.9 | 156.8 | 206.4 | 202.6 |
| 2014 | 169.1 | 159.0 | 210.8 | 205.7 |
| 2015 | 173.1 | 162.7 | 214.2 | 208.5 |
| 2016 | 174.8 | 167.2 | 218.9 | 210.0 |
| 2017 | 175.0 | 166.9 | 218.8 | 213.0 |
| 2018 | 175.7 | 170.6 | 222.3 | 217.3 |
| 2019 | 179.7 | 170.6 | 222.1 | 217.6 |
| 2020 | 179.5 | 174.6 | 227.2 | 224.6 |
| 2021 | 181.6 | 176.3 | 226.7 | 223.9 |
| 2022 | 183.4 | 177.6 | 229.7 | 227.2 |
| 2023 | 189.0 | 183.2 | 240.3 | 234.3 |
| 2024 | 200.5 | 191.7 | 251.3 | 244.9 |
| 2025 | 210.1 | 202.9 | 264.9 | 259.7 |
| Source | MHLW "Basic Survey on Wage Structures" | |||
- NOTES:
- From 2006 to 2019 : retroactive data