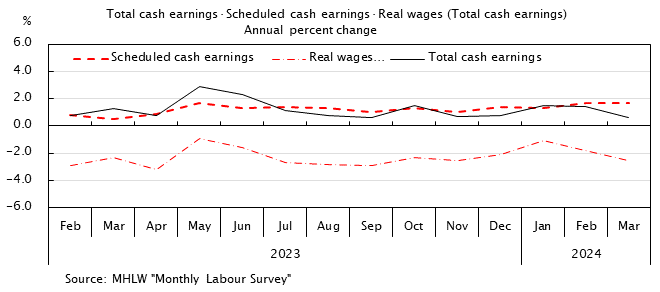
Average Monthly Cash Earnings of Regular Employees
| Total cash earnings | Real wages (Total cash earnings) 1) | Real wages (Total cash earnings) 2) | Contractual cash earnings |
Scheduled cash earnings |
|||||
|---|---|---|---|---|---|---|---|---|---|
| Annual percent change | Annual percent change | ||||||||
| Manu-facturing | Manu-facturing | Annual percent change |
Annual percent change |
Annual percent change |
|||||
| Calendar year | ¥ | % | % | % | % | % | % | % | |
| 2019 | 322,552 | -0.4 | -0.3 | -1.0 | -0.9 | -0.9 | -0.2 | -0.1 | |
| 2020 | 318,405 | -1.2 | -3.4 | -1.2 | -3.5 | -1.2 | -0.7 | 0.2 | |
| 2021 | 319,461 | 0.3 | 2.0 | 0.6 | 2.2 | 0.5 | 0.5 | 0.3 | |
| 2022 | 325,817 | 2.0 | 1.7 | -1.0 | -1.3 | -0.5 | 1.4 | 1.1 | |
| 2023 | 329,777 | 1.2 | 1.7 | -2.5 | -2.0 | -2.0 | 1.1 | 1.2 | |
| 2024 | 347,994 | 2.8 | 3.0 | -0.3 | -0.1 | 0.0 | 2.0 | 2.1 | |
| 2024 | Oct | 292,430 | 2.2 | 3.2 | -0.4 | 0.6 | 0.0 | 2.3 | 2.5 |
| Nov | 308,486 | 3.9 | 2.9 | 0.5 | -0.5 | 0.9 | 2.5 | 2.5 | |
| Dec | 617,375 | 4.4 | 5.3 | 0.3 | 1.1 | 0.7 | 2.4 | 2.6 | |
| 2025 | Jan | 292,468 | 1.8 | 3.3 | -2.8 | -1.4 | -2.2 | 2.2 | 2.1 |
| Feb | 288,697 | 2.7 | 3.7 | -1.5 | -0.5 | -0.8 | 1.4 | 1.3 | |
| Mar | 309,059 | 2.3 | 4.5 | -1.8 | 0.1 | -1.2 | 1.4 | 1.4 | |
| Apr | 301,698 | 2.0 | 3.3 | -2.0 | -0.9 | -1.5 | 2.1 | 2.1 | |
| May | 301,592 | 1.4 | 3.1 | -2.6 | -0.9 | -2.0 | 2.0 | 2.0 | |
| Jun | 514,106 | 3.1 | 7.5 | -0.8 | 3.6 | -0.1 | 2.0 | 2.0 | |
| Jul | 416,744 | 3.4 | 4.5 | -0.2 | 1.0 | 0.3 | 2.1 | 2.0 | |
| Aug | 299,955 | 1.3 | 3.3 | -1.7 | 0.2 | -1.4 | 1.8 | 1.9 | |
| Sep | 297,787 | 2.1 | 3.2 | -1.3 | -0.1 | -0.7 | 2.0 | 2.0 | |
| Oct | 299,801 | 2.5 | 3.7 | -0.8 | 0.4 | -0.5 | 2.5 | 2.4 | |
| Nov | r 313,531 | r 1.7 | r 3.8 | r -1.6 | r 0.5 | r -1.2 | r 1.9 | r 1.9 | |
| Source | MHLW "Monthly Labour Survey" | ||||||||
- NOTES:
- 5 or more regular employees.
- NOTES:
- Real wages (total cash earnings) 1) : deflated by Consumer Price Index (All items, less imputed rent). 2) : deflated by Consumer Price Index (All items).


