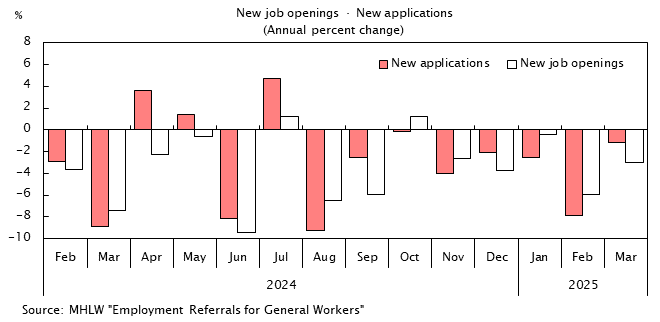
Job Openings, Job Applications and Placements
| Excluding new school graduates and including part-timers | ||||||||||
|---|---|---|---|---|---|---|---|---|---|---|
| Monthly active job openings | New job openings | Monthly active applications | New applications | Persons who found employment |
||||||
| * | * | * | * | |||||||
| Calendar year | persons | % | persons | % | persons | % | persons | % | persons | |
| 2020 | 2,161,104 | -21.0 | 750,864 | -21.7 | 1,827,866 | 6.9 | 384,804 | -2.8 | 103,156 | |
| 2021 | 2,195,881 | 1.6 | 781,572 | 4.1 | 1,948,626 | 6.6 | 386,571 | 0.5 | 104,935 | |
| 2022 | 2,473,966 | 12.7 | 866,369 | 10.8 | 1,935,621 | -0.7 | 382,607 | -1.0 | 101,431 | |
| 2023 | 2,496,403 | 0.9 | 866,937 | 0.1 | 1,909,496 | -1.3 | 379,330 | -0.9 | 101,861 | |
| 2024 | 2,413,695 | -3.3 | 836,071 | -3.6 | 1,929,824 | 1.1 | 371,214 | -2.1 | 97,271 | |
| 2025 | 2,329,885 | -3.5 | 805,071 | -3.7 | 1,906,836 | -1.2 | 365,874 | -1.4 | 91,665 | |
| 2025 | Apr | 2,362,579 | -1.6 | 839,759 | 2.2 | 1,998,267 | -1.8 | 513,564 | -1.1 | 104,639 |
| May | 2,313,881 | -2.1 | 786,018 | -5.2 | 2,027,657 | -2.0 | 392,219 | -4.5 | 97,594 | |
| Jun | 2,291,278 | -1.9 | 771,856 | -2.5 | 2,003,370 | -0.9 | 349,223 | 3.6 | 94,558 | |
| Jul | 2,299,869 | -2.8 | 833,113 | -1.2 | 1,943,851 | -1.0 | 359,459 | 0.3 | 90,925 | |
| Aug | 2,251,623 | -3.6 | 743,628 | -6.2 | 1,900,535 | -0.3 | 321,725 | 1.4 | 74,168 | |
| Sep | 2,277,911 | -3.5 | 780,853 | -3.2 | 1,905,974 | 0.2 | 352,513 | 0.9 | 89,501 | |
| Oct | 2,309,906 | -5.2 | 860,362 | -6.4 | 1,922,403 | -0.0 | 373,457 | -1.1 | 94,846 | |
| Nov | 2,260,284 | -7.0 | 719,092 | -10.4 | 1,842,150 | -1.7 | 293,427 | -6.3 | 78,571 | |
| Dec | 2,264,534 | -6.1 | 772,097 | -2.4 | 1,769,272 | -1.0 | 298,520 | 3.1 | 79,510 | |
| 2026 | Jan | 2,294,228 | -5.4 | 865,721 | -4.6 | 1,809,573 | -0.2 | 407,942 | 2.7 | 74,006 |
| Feb | 2,330,515 | -5.1 | 775,124 | -7.8 | 1,854,011 | -0.1 | 364,714 | 1.0 | 90,846 | |
| Mar | 2,319,596 | -5.1 | 785,351 | -2.6 | 1,908,594 | 0.5 | 395,232 | 4.5 | 125,652 | |
| Apr | 2,245,372 | -5.0 | 809,517 | -3.6 | 2,009,057 | 0.5 | 522,095 | 1.7 | 97,113 | |
| May | 2,191,784 | -5.3 | 715,916 | -8.9 | 2,020,909 | -0.3 | 369,315 | -5.8 | 84,707 | |
| Source | MHLW "Employment Referrals for General Workers" | |||||||||
- NOTES:
- * Annual percent change