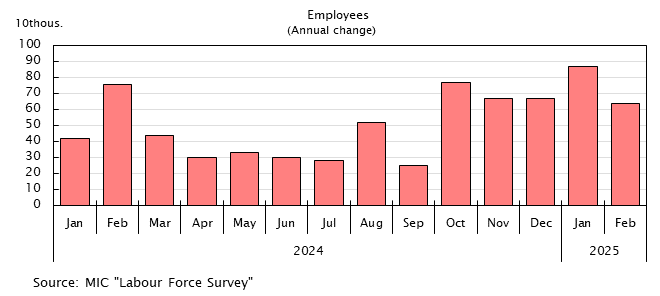
Employed and Employees
| Employed | Employees | |||||
|---|---|---|---|---|---|---|
| Annual
change |
Annual
change |
Women | ||||
| Non-agricultural industries | ||||||
| Weekly Hours of Work: 1-34hours |
||||||
| Calendar year | 10thous. | 10thous. | 10thous. | 10thous. | 10thous. | |
| 2019 | 6,750 | 68 | 6,028 | 74 | 1,248 | |
| 2020 | 6,710 | -40 | 6,005 | -23 | 1,255 | |
| 2021 | 6,713 | 3 | 6,016 | 11 | 1,271 | |
| 2022 | 6,723 | 10 | 6,041 | 25 | 1,275 | |
| 2023 | 6,747 | 24 | 6,076 | 35 | 1,248 | |
| 2024 | 6,781 | 34 | 6,123 | 47 | 1,301 | |
| 2024 | Oct | 6,813 | 42 | 6,166 | 77 | 1,244 |
| Nov | 6,814 | 34 | 6,167 | 67 | 1,236 | |
| Dec | 6,811 | 57 | 6,181 | 67 | 1,302 | |
| 2025 | Jan | 6,779 | 65 | 6,163 | 87 | 1,261 |
| Feb | 6,768 | 40 | 6,152 | 64 | 1,613 | |
| Mar | 6,770 | 44 | 6,138 | 58 | 1,263 | |
| Apr | 6,796 | 46 | 6,151 | 64 | 1,677 | |
| May | 6,838 | 72 | 6,174 | 78 | 1,254 | |
| Jun | 6,873 | 51 | 6,205 | 66 | 1,235 | |
| Jul | 6,850 | 55 | 6,197 | 84 | 1,254 | |
| Aug | 6,835 | 20 | 6,174 | 34 | 1,238 | |
| Sep | 6,863 | 49 | 6,201 | 52 | 1,238 | |
| Oct | 6,865 | 52 | 6,214 | 48 | 1,252 | |
| Nov | 6,862 | 48 | 6,227 | 60 | 1,621 | |
| Source | MIC "Labour Force Survey" | |||||


