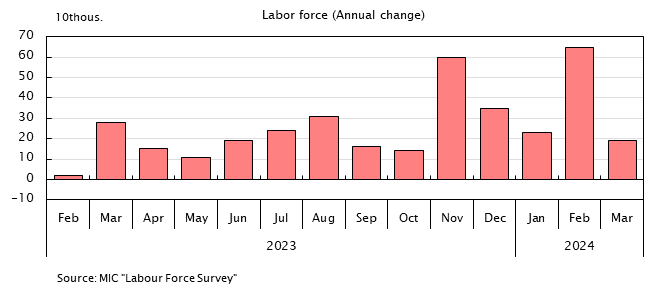
Population and Labor Force
| Population 15 years old and over |
Labor force | Labor force participation rate |
||||
|---|---|---|---|---|---|---|
| Annual change |
Annual change |
|||||
| Calendar year | 10thous. | 10thous. | 10thous. | % | point | |
| 2020 | 11,108 | 6,902 | -10 | 62.0 | -0.1 | |
| 2021 | 11,087 | 6,907 | 5 | 62.1 | 0.1 | |
| 2022 | 11,038 | 6,902 | -5 | 62.5 | 0.4 | |
| 2023 | 11,017 | 6,925 | 23 | 62.9 | 0.4 | |
| 2024 | 10,995 | 6,957 | 32 | 63.3 | 0.4 | |
| 2025 | 10,973 | 7,004 | 47 | 63.8 | 0.5 | |
| 2024 | Nov | 10,997 | 6,978 | 29 | 63.5 | 0.4 |
| Dec | 10,984 | 6,965 | 55 | 63.4 | 0.6 | |
| 2025 | Jan | 10,982 | 6,942 | 65 | 63.2 | 0.6 |
| Feb | 10,976 | 6,933 | 28 | 63.2 | 0.4 | |
| Mar | 10,975 | 6,949 | 38 | 63.3 | 0.5 | |
| Apr | 10,972 | 6,984 | 41 | 63.7 | 0.6 | |
| May | 10,976 | 7,021 | 62 | 64.0 | 0.7 | |
| Jun | 10,972 | 7,049 | 46 | 64.2 | 0.5 | |
| Jul | 10,976 | 7,019 | 36 | 63.9 | 0.4 | |
| Aug | 10,967 | 7,017 | 27 | 64.0 | 0.4 | |
| Sep | 10,974 | 7,046 | 59 | 64.2 | 0.7 | |
| Oct | 10,975 | 7,047 | 63 | 64.2 | 0.7 | |
| Nov | 10,975 | 7,033 | 55 | 64.1 | 0.6 | |
| Dec | 10,957 | 7,007 | 42 | 63.9 | 0.5 | |
| Source | MIC "Labour Force Survey" | |||||


