Other Economic Indicators
| Machinery orders 1) | New housing construction started | Bankruptcy | Average contracted
interest rate on loans & discounts 2) |
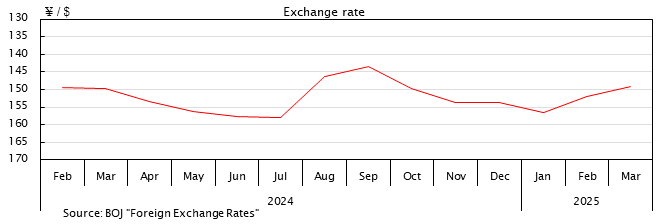
Exchange rate 3) | ||
|---|---|---|---|---|---|---|
| Change from previous period |
Change from previous period |
Annual percent change |
||||
| Calendar year | % | % | % | % / year | ¥ / $ | |
| 2020 | -8.4 | -9.9 | -7.27 | 0.814 | 106.78 | |
| 2021 | 6.8 | 5.0 | -22.42 | 0.795 | 109.80 | |
| 2022 | 5.2 | 0.4 | 6.60 | 0.771 | 131.38 | |
| 2023 | -3.6 | -4.6 | 35.18 | 0.779 | 140.48 | |
| 2024 | 1.5 | -3.3 | 15.14 | 0.943 | 151.48 | |
| 2025 | 2.93 | 149.66 | ||||
| (S.A.) % | (S.A.) % | % | % / year | ¥ / $ | ||
| 2024 | Nov | 2.6 | -0.7 | 4.21 | 0.892 | 153.72 |
| Dec | -0.8 | 1.3 | 3.95 | 0.943 | 153.72 | |
| 2025 | Jan | -3.5 | -1.2 | 19.82 | 0.973 | 156.49 |
| Feb | 4.3 | 4.1 | 7.30 | 0.997 | 151.96 | |
| Mar | 13.0 | 34.6 | -5.84 | 1.045 | 149.18 | |
| Apr | -9.1 | -42.2 | 5.74 | 1.063 | 144.39 | |
| May | -0.6 | -15.6 | -15.06 | 1.073 | 144.75 | |
| Jun | 3.0 | 22.4 | 3.41 | 1.125 | 144.50 | |
| Jul | -4.6 | 9.9 | 0.83 | 1.137 | 146.71 | |
| Aug | -0.9 | -0.1 | 11.34 | 1.140 | 147.67 | |
| Sep | 4.2 | 2.4 | 8.17 | 1.154 | 147.94 | |
| Oct | 7.0 | 10.2 | 6.16 | 1.159 | 151.28 | |
| Nov | -11.0 | -10.6 | -7.49 | 1.164 | 155.12 | |
| Dec | 10.21 | 155.88 | ||||
| Source | CAO "Machinery Orders" |
MLIT "Monthly Economic Construction Statistics" |
TSR "Business Failure Report" |
BOJ "Average Contracted Interest Rates on Loans and Discounts" |
BOJ "Foreign Exchange Rates" |
|
- NOTES:
- 1) Private sector (exc. volatile orders for ships and those from electric power companies)
2) Outstanding Loans and Bills Discounted, Total, Domestically Licensed Banks
3) US.Dollar/Yen Central Rate, Average in the Month, Tokyo Market


