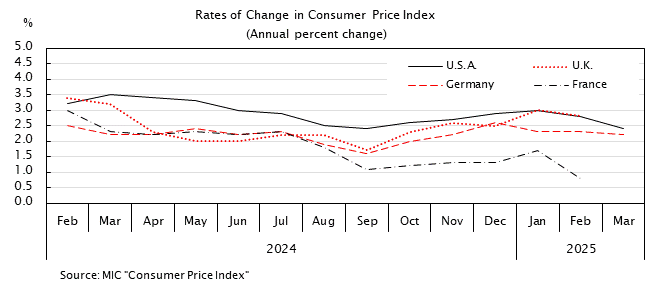
Consumer Price Index of Selected Countries
| Consumer Price Index | |||||
|---|---|---|---|---|---|
| U.S.A. | U.K. | Germany | France | ||
| Annual change |
Annual change |
Annual change |
Annual change |
||
| Calendar year | % | % | % | % | |
| 2020 | 1.2 | 0.9 | 0.5 | 0.5 | |
| 2021 | 4.7 | 2.6 | 3.1 | 1.6 | |
| 2022 | 8.0 | 9.1 | 6.9 | 5.2 | |
| 2023 | 4.1 | 7.3 | 5.9 | 4.9 | |
| 2024 | 2.9 | 2.5 | 2.2 | 2.0 | |
| 2025 | 2.6 | 2.2 | 0.9 | ||
| 2024 | Nov | 2.7 | 2.6 | 2.2 | 1.3 |
| Dec | 2.9 | 2.5 | 2.6 | 1.3 | |
| 2025 | Jan | 3.0 | 3.0 | 2.3 | 1.7 |
| Feb | 2.8 | 2.8 | 2.3 | 0.8 | |
| Mar | 2.4 | 2.6 | 2.2 | 0.8 | |
| Apr | 2.3 | 3.5 | 2.1 | 0.8 | |
| May | 2.4 | 3.4 | 2.1 | 0.7 | |
| Jun | 2.7 | 3.6 | 2.0 | 1.0 | |
| Jul | 2.7 | 3.8 | 2.0 | 1.0 | |
| Aug | 2.9 | 3.8 | 2.2 | 0.9 | |
| Sep | 3.0 | 3.8 | 2.4 | 1.2 | |
| Oct | - | 3.6 | 2.3 | 0.9 | |
| Nov | 2.7 | 3.2 | 2.3 | 0.9 | |
| Dec | 2.7 | 1.8 | 0.8 | ||
| Source | MIC "Consumer Price Index (Monthly Report Reference Table) " | ||||


