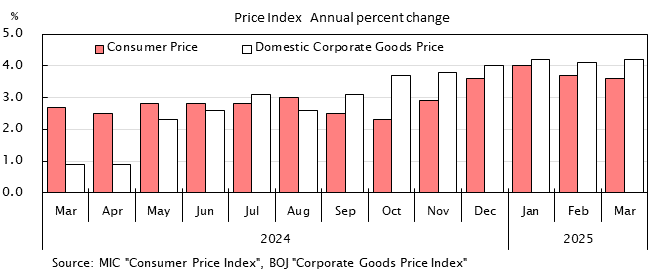
Prices
| Consumer price | Domestic Corporate Goods price |
||||||
|---|---|---|---|---|---|---|---|
| All items | All items, less fresh food | All items, less fresh food and energy | |||||
| Index | Annual change |
Annual change |
Annual change |
Index | Annual change |
||
| Calendar year | % | % | % | % | |||
| 2020 | 100.0 | 0.0 | -0.2 | 0.2 | 100.0 | -1.2 | |
| 2021 | 99.8 | -0.2 | -0.2 | -0.5 | 104.6 | 4.6 | |
| 2022 | 102.3 | 2.5 | 2.3 | 1.1 | 114.9 | 9.8 | |
| 2023 | 105.6 | 3.2 | 3.1 | 4.0 | 119.9 | 4.4 | |
| 2024 | 108.5 | 2.7 | 2.5 | 2.4 | 122.8 | 2.4 | |
| 2025 | 111.9 | 3.2 | 3.1 | 3.0 | 126.7 | 3.2 | |
| 2024 | Dec | 110.7 | 3.6 | 3.0 | 2.4 | 125.1 | 4.1 |
| 2025 | Jan | 111.2 | 4.0 | 3.2 | 2.5 | 125.5 | 4.2 |
| Feb | 110.8 | 3.7 | 3.0 | 2.6 | 125.8 | 4.3 | |
| Mar | 111.1 | 3.6 | 3.2 | 2.9 | 126.2 | 4.3 | |
| Apr | 111.5 | 3.6 | 3.5 | 3.0 | 126.6 | 3.9 | |
| May | 111.8 | 3.5 | 3.7 | 3.3 | 126.5 | 3.1 | |
| Jun | 111.7 | 3.3 | 3.3 | 3.4 | 126.4 | 2.8 | |
| Jul | 111.9 | 3.1 | 3.1 | 3.4 | 126.7 | 2.5 | |
| Aug | 112.1 | 2.7 | 2.7 | 3.3 | 126.4 | 2.6 | |
| Sep | 112.0 | 2.9 | 2.9 | 3.0 | 127.0 | 2.8 | |
| Oct | 112.8 | 3.0 | 3.0 | 3.1 | 127.6 | 2.7 | |
| Nov | 113.2 | 2.9 | 3.0 | 3.0 | r 128.0 | r 2.7 | |
| Dec | 113.0 | 2.1 | 2.4 | 2.9 | 128.1 | 2.4 | |
| 2026 | Jan | [ 111.9] | [ 1.5] | [ 2.0] | [ 2.4] | ||
| Source | MIC "Consumer Price Index" |
BOJ "Corporate Goods Price Index" |
|||||
- NOTES:
- 2020=100
Figures in brackets show Ku-area of Tokyo(preliminary).


