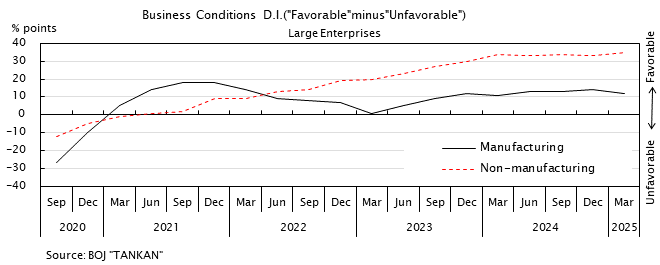
Business Conditions
| Large Enterprises | ||||||
|---|---|---|---|---|---|---|
| Business Conditions D.I. | Sales | Ratio of
Current Profit to Sales |
||||
| Manufacturing | Non- manufacturing |
Manufacturing | Non- manufacturing |
All industries | ||
| %Points | %Points | % | % | % | ||
| 2021 | Sep | 18 | 2 | |||
| Dec | 18 | 9 | 5.7 | 3.0 | 7.71 | |
| 2022 | Mar | 14 | 9 | |||
| Jun | 9 | 13 | 12.5 | 12.5 | 10.26 | |
| Sep | 8 | 14 | ||||
| Dec | 7 | 19 | 10.2 | 8.0 | 7.66 | |
| 2023 | Mar | 1 | 20 | |||
| Jun | 5 | 23 | 4.4 | 2.2 | 11.39 | |
| Sep | 9 | 27 | ||||
| Dec | 12 | 30 | 2.4 | -0.1 | 8.51 | |
| 2024 | Mar | 11 | 34 | |||
| Jun | 13 | 33 | 2.9 | 3.8 | 10.75 | |
| Sep | 13 | 34 | ||||
| Dec | 14 | 33 | 3.2 | 4.0 | 9.23 | |
| 2025 | Mar | 12 | 35 | |||
| Jun | 13 | 34 | 0.5 | 1.9 | 11.29 | |
| Sep | 14 | 34 | ||||
| Dec | 15 | 34 | 4.2 | 2.0 | 9.61 | |
| 2026 | Mar | 17 | 36 | |||
| Jun | 22 | 37 | (4.9) | (3.9) | (9.94) | |
| Sep | (17) | (28) | ||||
| Dec | (3.2) | (3.1) | (8.88) | |||
| Source | BOJ "TANKAN" | |||||
- NOTES:
- D.I. <"Favorable" minus "Unfavorable">
( ) Forecast
Large Enterprises = 1000 employees and over