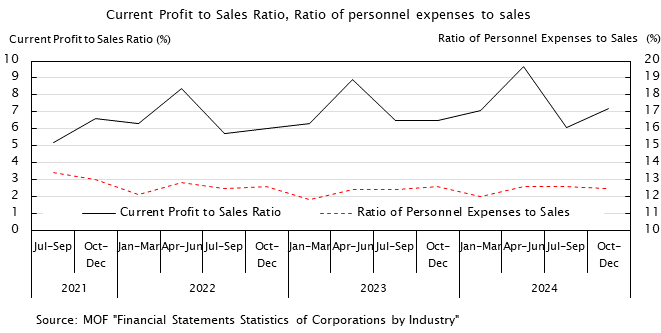
Business Operation and Labor's Share
| Total Sales | Current Profit to Sales Ratio |
Ratio of Personnel Expenses to Sales | Labor's Share | ||
|---|---|---|---|---|---|
| Annual percent change |
|||||
| Fiscal year | % | % | % | % | |
| 2019 | -3.5 | 4.8 | 13.6 | 71.0 | |
| 2020 | -8.1 | 4.6 | 14.3 | 74.2 | |
| 2021 | 6.3 | 5.8 | 14.3 | 71.7 | |
| 2022 | 9.0 | 6.0 | 13.6 | 70.7 | |
| 2023 | 3.5 | 6.5 | 13.6 | 68.3 | |
| 2024 | 3.6 | 6.8 | 13.6 | 69.5 | |
| 2022 | Apr-Jun | 7.2 | 8.4 | 12.8 | 74.9 |
| Jul-Sep | 8.3 | 5.7 | 12.5 | 71.0 | |
| Oct-Dec | 6.1 | 6.0 | 12.6 | 76.2 | |
| 2023 | Jan-Mar | 5.0 | 6.3 | 11.8 | 60.4 |
| Apr-Jun | 5.8 | 8.9 | 12.4 | 72.6 | |
| Jul-Sep | 5.0 | 6.5 | 12.4 | 66.7 | |
| Oct-Dec | 4.2 | 6.5 | 12.6 | 72.9 | |
| 2024 | Jan-Mar | 2.3 | 7.1 | 12.0 | 60.5 |
| Apr-Jun | 3.5 | 9.7 | 12.6 | 73.8 | |
| Jul-Sep | 2.6 | 6.1 | 12.6 | 63.0 | |
| Oct-Dec | 2.5 | 7.2 | 12.5 | 79.1 | |
| 2025 | Jan-Mar | 4.3 | 7.0 | 11.9 | 61.9 |
| Apr-Jun | 0.8 | 9.6 | 13.1 | - | |
| Jul-Sep | 0.5 | 7.3 | 13.1 | - | |
| Source | MOF “Financial Statements of Corporations by Industry” |
CAO “SNA” | |||
- NOTES:
- Labor's share = Compensation of employees / National income at factor cost × 100. Calculated by JILPT. Annual Report on National Accounts for 2024.
Ratio of Personnel Expenses to Sales (Fiscal year) = Calculated by JILPT


