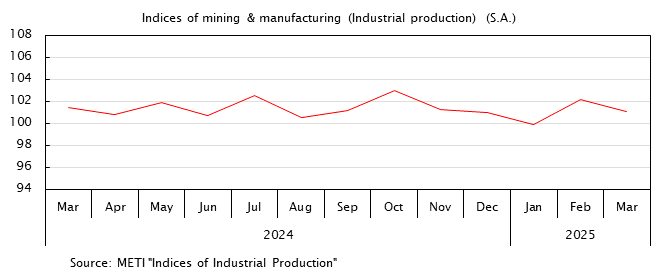
Industrial Productions, Shipments and Inventories
| Indices of mining & manufacturing | ||||||
|---|---|---|---|---|---|---|
| Industrial production | Shipment | Inventory | Inventory ratio |
|||
| Change from previous period |
||||||
| Calendar year | % | |||||
| 2020 | 100.0 | -10.4 | 100.0 | 92.6 | 100.0 | |
| 2021 | 105.4 | 5.4 | 104.4 | 98.5 | 89.8 | |
| 2022 | 105.3 | -0.1 | 103.9 | 101.2 | 96.6 | |
| 2023 | 103.9 | -1.3 | 103.2 | 100.7 | 104.0 | |
| 2024 | 101.2 | -2.6 | 99.9 | 98.8 | 106.1 | |
| 2025 | p 102.0 | p 0.8 | p 100.3 | p 96.1 | p 105.9 | |
| (S.A.) | (S.A.)% | (S.A.) | (S.A.) | (S.A.) | ||
| 2024 | Dec | 101.0 | -0.3 | 99.5 | 101.1 | 106.9 |
| 2025 | Jan | 99.9 | -1.1 | 98.5 | 102.6 | 106.5 |
| Feb | 102.2 | 2.3 | 101.5 | 100.9 | 102.8 | |
| Mar | 102.4 | 0.2 | 99.7 | 102.1 | 107.3 | |
| Apr | 101.3 | -1.1 | 99.8 | 101.3 | 106.7 | |
| May | 101.2 | -0.1 | 102.2 | 99.5 | 105.5 | |
| Jun | 103.3 | 2.1 | 101.4 | 99.2 | 106.4 | |
| Jul | 102.1 | -1.2 | 99.3 | 100.1 | 106.5 | |
| Aug | 100.6 | -1.5 | 99.5 | 99.1 | 109.0 | |
| Sep | 103.2 | 2.6 | 100.6 | 99.9 | 106.5 | |
| Oct | 104.7 | 1.5 | 102.3 | 100.3 | 104.0 | |
| Nov | 101.9 | -2.7 | 100.6 | 97.3 | 104.2 | |
| Dec | p 101.8 | p -0.1 | p 98.9 | p 98.3 | p 106.2 | |
| 2026 | Jan | (9.3) | ||||
| Feb | (-4.3) | |||||
| Source | METI "Indices of Industrial Production" | |||||
- NOTES:
- () Forecast on manufacturing, 2020=100.


