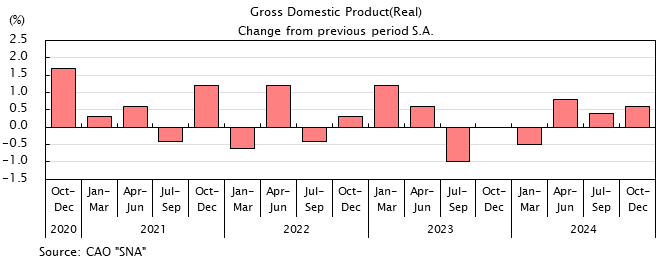
National Accounts
| Gross Domestic Product | Compensation of employees (nominal) |
|||||
|---|---|---|---|---|---|---|
| Nominal | Real | Per capita | ||||
| Change from previous period |
Change from previous period |
Annual percent change |
Annual percent change |
|||
| Fiscal year | ¥billion | % | % | % | % | |
| 2019 | 570,618.9 | 0.1 | -0.9 | 1.9 | 0.7 | |
| 2020 | 554,342.3 | -2.9 | -3.8 | -1.6 | -0.8 | |
| 2021 | 576,554.0 | 4.0 | 3.9 | 2.7 | 2.4 | |
| 2022 | 591,651.3 | 2.6 | 1.4 | 2.6 | 2.0 | |
| 2023 | 619,390.4 | 4.7 | -0.0 | 1.8 | 1.1 | |
| 2024 | 642,414.7 | 3.7 | 0.5 | 4.1 | 3.3 | |
| (S.A.) % | (S.A.) % | % | % | |||
| 2021 | Jul-Sep | 139,641.6 | 0.0 | -0.1 | 3.2 | 2.6 |
| Oct-Dec | 150,907.8 | 1.1 | 1.2 | 2.2 | 2.5 | |
| 2022 | Jan-Mar | 145,033.9 | 0.1 | -0.4 | 2.0 | 2.3 |
| Apr-Jun | 143,711.0 | 0.6 | 1.0 | 2.6 | 1.9 | |
| Jul-Sep | 141,719.4 | -0.2 | -0.4 | 2.5 | 1.9 | |
| Oct-Dec | 154,436.3 | 2.0 | 0.4 | 3.5 | 2.8 | |
| 2023 | Jan-Mar | 151,784.6 | 2.0 | 0.7 | 1.6 | 1.2 |
| Apr-Jun | 151,771.6 | 1.9 | 0.3 | 2.7 | 2.1 | |
| Jul-Sep | 150,454.6 | 0.0 | -1.4 | 1.4 | 0.7 | |
| Oct-Dec | 162,022.1 | 1.0 | 0.4 | 1.3 | 0.6 | |
| 2024 | Jan-Mar | 155,142.0 | -0.7 | -0.5 | 1.8 | 0.9 |
| Apr-Jun | 155,368.7 | 2.1 | 0.2 | 3.5 | 3.0 | |
| Jul-Sep | 155,702.1 | 1.1 | 0.7 | 4.0 | 3.4 | |
| Oct-Dec | 168,013.2 | 1.1 | 0.3 | 5.1 | 3.9 | |
| 2025 | Jan-Mar | 163,330.8 | 0.9 | 0.4 | 3.9 | 2.7 |
| Apr-Jun | 163,645.3 | 2.1 | 0.5 | 4.0 | 2.8 | |
| Jul-Sep | 162,045.6 | -0.1 | -0.6 | 3.4 | 2.4 | |
| Source | CAO "SNA(National Accounts of Japan)" |
CAO "SNA" MIC "Labour Force Survey" |
||||
- NOTES:
- Benchmark year=2020.
Compensation of employees per capita = Compensation of employees / Number of employees.
Data of number of employees are the compatible time-series data adjusted to the 2020-base benchmark revision.
Quarterly Estimates of GDP: Jul. - Sep. 2025 (The 2nd Preliminary Estimates)


