
Recent Statistical Survey Reports, February 2026
Statistical Survey Reports
Survey on Public Assistance Recipients (November)
February 4, released by the Ministry of Health, Labour and Welfare
The number of welfare recipients in November was 1,982,936 and the number of households of welfare recipients was 1,644,984.
Family Income and Expenditure Survey (December and 2025)
February 6, released by the Ministry of Internal Affairs and Communications
The average monthly income for a worker’s households with 2 or more family members was 0.0% in real terms from the previous year. The change over the year of wages & salaries was down 1.0% in real terms from the previous year (household heads: -2.6% in real terms, spouse of household: 1.9% in real terms).
The average of consumption expenditures for a worker’s household with 2 or more family members was down 3.6% in real terms from the previous year.
The average monthly income for a worker’s households with 2 or more family members was down 0.9% in real terms from the previous year. The average of consumption expenditures for a worker’s household with 2 or more family members was up 2.7% in real terms from the previous year.
Indexes of Business Conditions December 2025 (Preliminary Release)
February 6, released by the Cabinet Office
The Coincident Index of Composite Index (CI, preliminary figures, 2020=100) in December was 114.5, decreased by 0.4 point from the previous month. And 3 months backward moving average was decreased by 0.13 point, and 7 months backward moving average was decreased by 0.14 point. So, the Assessment of Coincident Index was “Halting to fall” (The same as the previous month (Revised Release))
The Leading Index was 110.2, an increase of 0.3 point, and the Lagging Index was 110.8, a decrease of 2.1 point.
February 26 Indexes of Business Conditions December 2025 (Revision of the Preliminary Release)
Monthly Labour Survey (Provisional Report in December and 2025)
February 9, released by the Ministry of Health, Labour and Welfare
Total amount of cash earnings increased by 2.4% (full-time employees increased by 2.7%, part-time employees increased by 1.1%) from a year earlier and contractual cash earnings increased by 2.1% (full-time employees increased by 2.4%, part-time employees increased by 1.7%) from a year earlier.
Special cash earnings increased by 2.6 % from a year earlier. Scheduled cash earnings increased by 2.2 % and non-scheduled cash earnings increased by 0.9% from a year earlier. Real wage (total cash earnings) (deflated by CPI (all items less imputed rent)) decreased by 0.1%, real wage (total cash earnings) (deflated by CPI (all items)) increased by 0.3 % and real wage (contractual cash earnings) (deflated by CPI (all items less imputed rent)) decreased by 0.3 % from a year earlier.
Total hours decreased by 1.7%, scheduled hours worked decreased by 1.6% and non-scheduled hours worked decreased by 3.0% from a year earlier.
Non-scheduled hours worked by manufacturing industry workers decreased by 0.7% from the previous month (seasonally adjusted).
Total amount of cash earnings in 2025 increased by 2.3% (full-time employees increased by 2.9%, part-time employees increased by 2.3%) from a year earlier and contractual cash earnings increased by 2.0% (full-time employees increased by 2.3%, part-time employees increased by 2.3%) from a year earlier.
Special cash earnings increased by 3.8 % from a year earlier. Scheduled cash earnings increased by 2.0 % and non-scheduled cash earnings increased by 1.3% from a year earlier. Real wage (total cash earnings) (deflated by CPI (all items less imputed rent)) decreased by 1.3%, real wage (total cash earnings) (deflated by CPI (all items)) decreased by 0.8 % and real wage (contractual cash earnings) (deflated by CPI (all items less imputed rent)) decreased by 1.6 % from a year earlier.
Total hours decreased by 1.4%, scheduled hours worked decreased by 1.3% and non-scheduled hours worked decreased by 2.6% from a year earlier.
February 25 Monthly Labour Survey (Final Report in December)
Survey on Situation of Preliminary Job Offers for New Senior High School Graduates (End of October 2025)
February 10, released by the Ministry of Education, Culture, Sports, Science and Technology
The ratio of final-year senior high school students with preliminary job offers at the end of October 2025, was 76.0%.
Labor Force Survey: Detailed Tabulation (Oct.-Dec. 2026)
February 13 released by the Ministry of Internal Affairs and Communications![]()
Of the total 58.66 million employee (excl. executive of company or corporation) (average, in Oct. - Dec. 2026), the number of the regular employees increased by 750 thousand from the previous year to 37.40 million and the number of non-regular employees was 21.26 million, decreased by 320 thousand from the previous year.
Of the total 58.28 million employee (excl. executive of company or corporation) (average, in 2026), the number of the regular employees increased by 550 thousand from the previous year to 37.00 million and the number of non-regular employees was 21.28 million, increased by 20 thousand from the previous year.
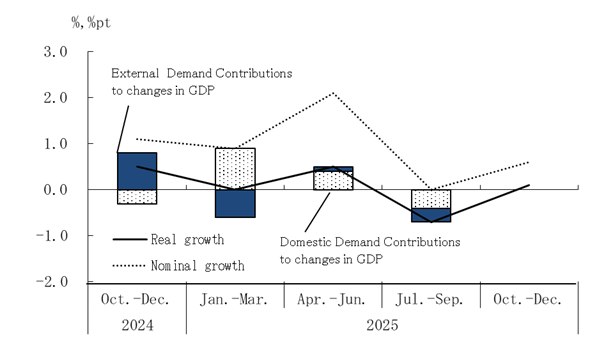
National Accounts (The 1st Preliminary Estimates Oct.-Dec.2025)
February 16, released by the Cabinet Office![]()
Real GDP (Gross Domestic Product) growth rate (Seasonally Adjusted) at Oct.-Dec.2025 was 0.1% (0.2% on annual basis). Of real GDP growth rate, 0.0%pt was contributed by domestic demand and 0.0pt% by external demand.
Nominal GDP growth rate (Seasonally Adjusted) at Oct.-Dec 2025 was 0.6% (2.3% on annual basis).
Compensation of Employees (real) was 0.5% (uses consumption of households (excluding imputed rent and FISIM) deflator) and 0.5% (uses consumption of households deflator) (changes from the previous quarter (seasonally adjusted)). Compensation of Employees (nominal) was 1.0% (changes from the previous quarter (seasonally adjusted)).
Quartely Estimates of GDP: Oct.~Dec.2025 (The 1st Preliminary Estimates) Growth rate of GDP from the previous Quarters(seasonally adjusted) Contributions of Domestic Demand and External Demand to Changes in GDP
Indices of Industrial Production (Revised Report for December 2025)
February 16, released by the Ministry of Economy, Trade and Industry![]()
The index of industrial production (seasonally adjusted, 2020=100) was 101.8, decreased by 0.1% from the previous month.
Consumer Price Index Japan (January)
February 20, released by the Ministry of Internal Affairs and Communications![]()
The consumer price index for Japan in January 2026 was 112.9 (2020=100), up 1.5% over the year. All items, less fresh food, the comprehensive index was 112.0, up 2.0% from the previous year. All items less imputed rent was 115.1 up 1.7% from the previous year. All items, less fresh food and energy, the comprehensive index was 111.4, up 2.6% from the previous year.
Monthly Labour Survey (Final Report in December and 2025)
February 25, released by the Ministry of Health, Labour and Welfare
Total amount of cash earnings increased by 2.4% (full-time employees increased by 2.8%, part-time employees increased by 1.8%) from a year earlier and contractual cash earnings increased by 2.0% (full-time employees increased by 2.4%, part-time employees increased by 2.1%) from a year earlier.
Special cash earnings increased by 2.7% from a year earlier. Scheduled cash earnings increased by 2.1% and non-scheduled cash earnings increased by 1.5% from a year earlier. Real wage (total cash earnings) (deflated by CPI (all items less imputed rent)) decreased by 0.1%, real wage (total cash earnings) (deflated by CPI (all items)) increased by 0.3% and real wage (contractual cash earnings) (deflated by CPI (all items less imputed rent)) decreased by 0.4% from a year earlier.
Total hours decreased by 1.6%, scheduled hours worked decreased by 1.6% and non-scheduled hours worked decreased by 2.0% from a year earlier.
Non-scheduled hours worked by manufacturing industry workers unchanged from the previous month (seasonally adjusted).
Total amount of cash earnings in 2025 increased by 2.3% (full-time employees increased by 2.9%, part-time employees increased by 2.3%) from a year earlier and contractual cash earnings increased by 2.0% (full-time employees increased by 2.3%, part-time employees increased by 2.3%) from a year earlier.
Special cash earnings increased by 3.8 % from a year earlier. Scheduled cash earnings increased by 2.0 % and non-scheduled cash earnings increased by 1.3% from a year earlier. Real wage (total cash earnings) (deflated by CPI (all items less imputed rent)) decreased by 1.3%, real wage (total cash earnings) (deflated by CPI (all items)) decreased by 0.8 % and real wage (contractual cash earnings) (deflated by CPI (all items less imputed rent)) decreased by 1.6 % from a year earlier.
Total hours decreased by 1.4%, scheduled hours worked decreased by 1.3% and non-scheduled hours worked decreased by 2.5% from a year earlier.
Survey on Supply and Demand of Construction Labor
February 25, released by the Ministry of Land, Infrastructure, Transport and Tourism
Indexes of Business Conditions December 2025 (Revised Release)
February 26, released by the Cabinet Office
The Coincident Index of Composite Index (CI, revised figures, 2020=100) in December was 114.3, decreased by 0.6 point. And 3 months backward moving average decreased by 0.20 point, and 7 months backward moving average decreased by 0.17 point. So, the Assessment of Coincident Index was “Halting to fall” (The same as Preliminary Release.)
The Leading Index was 111.0, an increase of 1.1 point and the Lagging Index was 110.3, a decrease of 2.2 point.
Consumer Price Index Ku-area of Tokyo (February) (preliminary)
February 27, released by the Ministry of Internal Affairs and Communications![]()
The consumer price index for Ku-area of Tokyo in February 2026 (preliminary) was 111.4 (2020=100), up 1.6% from the previous year. All items, less fresh food, the comprehensive index was 110.5 up 1.8% from the previous year. All items less imputed rent was 113.6 up 1.6% from the previous year. All items, less fresh food and energy, the comprehensive index was 110.6 up 2.5% from the previous year.
Indices of Industrial Production (Preliminary Report for January 2026)
February 27, released by the Ministry of Economy, Trade and Industry![]()
The index of industrial production (seasonally adjusted, 2020=100) was 104.0, increased by 2.2% from the previous month. According to the Survey of Production Forecast in Manufacturing, Production is expected to decrease in February and March.
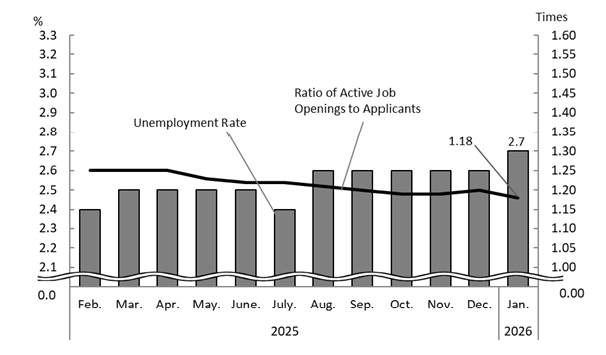
Labour Force Survey (January)
March 3, released by the Ministry of Internal Affairs and Communications![]()
The unemployment rate (seasonally adjusted) was 2.7%, increased by 0.1 point from the previous month. That for men was 2.9%, unchanged from the previous month and that for women was 2.5%, increased by 0.2 point from the previous month. The number of unemployed persons (seasonally adjusted) was 1.91 million, increased by 60 thousand from the previous month.
The number of employees was 61.85 million, increased by 220 thousand from the previous year.
Among them, the number of regular employee was 36.87 million, increased by 570 thousand from the previous year and the number of non-regular employee was 21.55 million, decreased by 370 thousand from the previous year.
Employment Referrals for General Workers (January)
March 3, released by the Ministry of Health, Labour and Welfare
Active job openings-to-applicants ratio (seasonally adjusted) was 1.18, decreased by 0.02 point from the previous month.
The number of monthly active job openings (person(s)) (seasonally adjusted) was decreased by 0.1% from the previous month and the number of monthly active applications (person(s)) (seasonally adjusted) was increased by 0.9% from the previous month.
New job openings-to-applicants ratio (seasonally adjusted) was 2.11, decreased by 0.03 point from the previous month.
Active job openings-to-applicants ratio for regular staff (seasonally adjusted) was 0.99, unchanged from the previous month.
Trend in Unemployment Rate and Ratio of Active Job Openings to Applicants (seasonally adjusted)
Other Reports
Monthly Economic Report (February)
February 25 released by the Cabinet Office![]()
The Japanese economy is recovering at a moderate pace, while the effects caused from the U.S. trade policies remain. (In the previous month, “The Japanese economy is recovering at a moderate pace, while the effects caused from the U.S. trade policies are seen mainly in the automotive industry”)
- Private consumption shows movements of picking up. (The same as the previous month)
- Business investment is picking up moderately. (The same as the previous month)
- Exports are almost flat. (The same as the previous month)
- Industrial production is flat. (The same as the previous month)
- Corporate profits, while affected by the U.S. trade policies, show movements of improvement. Firms' judgments on current business conditions have been almost flat. (In the previous month, “Movements of improvement in corporate profits appear to be pausing, while the effects caused from the U.S. trade policies are seen mainly in the automotive industry. Firms' judgments on current business conditions have been almost flat”)
- The employment situation shows movements of improvement. (The same as the previous month)
- Consumer prices have been rising at a slower tempo recently. (In the previous month, “Consumer prices have been rising”)
| To view PDF files, you will need Adobe Acrobat Reader Software installed on your computer.The Adobe Acrobat Reader can be downloaded from this banner. |
