
Recent Statistical Survey Reports, May 2022
Statistical Survey Reports
Consumer Price Index Ku-area of Tokyo (April) (preliminary)
May 6, released by the Ministry of Internal Affairs and Communications
The consumer price index for Ku-area of Tokyo in April 2022(preliminary) was 101.6(2020=100), up 2.5% from the previous year. All items, less fresh food, the comprehensive index was101.3, up 1.9% from the previous year. All items, less fresh food and energy, the comprehensive index was 100.3, up 0.8% from the previous year.
Monthly Labour Survey (Provisional Report in March)
May 9, released by the Ministry of Health, Labour and Welfare![]()
Total amount of cash earnings increased by 1.2% and contractual cash earnings increased by 0.6% (full-time employees 0.8%, part-time employees unchanged) from a year earlier.
Special cash earnings increased by 10.7% from a year earlier. Scheduled cash earnings increased by 0.5% and non-scheduled cash earnings increased by 2.5% from a year earlier. Real wage (total cash earnings) decreased by 0.2% from a year earlier and real wage (contractual cash earnings) decreased by 0.8% from a year earlier.
Total hours decreased by 1.6%, scheduled hours worked decreased by 2.0% from a year earlier and non-scheduled hours worked increased by 2.8% from a year earlier.
Non-scheduled hours worked by manufacturing industry workers increased by 0.7% from the previous month (seasonally adjusted).
May 24 Monthly Labour Survey (Final Report in March)
Family Income and Expenditure Survey (March)
May 10, released by the Ministry of Internal Affairs and Communications
The average monthly income for a worker’s households with 2 or more family members was up 2.3% in real terms from the previous year. The change over the year of wages & salaries was up 1.5% in real terms from the previous year (household heads: 2.2% in real terms, spouse of household: 3.7% in real terms).
The average of consumption expenditures for a worker’s household with 2 or more family members was down 1.6% in real terms from the previous year.
Indexes of Business Conditions March 2022 (Preliminary Release)
May 11, released by the Cabinet Office
The Coincident Index of Composite Index (CI, revised figures, 2015=100) in March was 97.0, an increase of 0.2 point. And 3 months backward moving average increased by 0.03 point, and 7 months backward moving average increased by 0.60 point. So the Assessment of Coincident Index was "Improving" (In the previous month, "Weakening")
The Leading Index was 101.0, an increase of 0.9 point, and the Lagging Index was 95.7, an increase of 0.6 point.
May 25 Indexes of Business Conditions March 2022(Revision of the Preliminary Release
Survey on Public Assistance Recipients (February)
May 11, released by the Ministry of Health, Labour and Welfare
The number of welfare recipients in February was 2,034,226 and the number of households of welfare recipients was 1,641,640.
Labor Force Survey: Detailed Tabulation (Jan.-Mar. 2022)
May 13, released by the Ministry of Internal Affairs and Communications![]()
Of the total 56.40 million employee (excl. executive of company or corporation) (average, in the Jan. - Mar. 2022), the number of the regular employees decreased by 100 thousand from the previous year to 36.58 million and the number of non-regular employees was 20.73 million, increased by 80 thousand from the previous year.
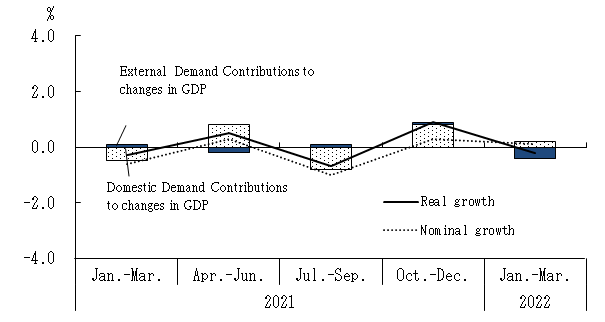
National Accounts (The 1st Preliminary Estimates Jan.-Mar.2022)
May 18, released by the Cabinet Office![]()
Real GDP (Gross Domestic Product) growth rate (Seasonally Adjusted) at Jan.-Mar.2022 was -0.2% (-1.0% on annual basis). Of real GDP growth rate, 0.2% was contributed by domestic demand and -0.4% by external demand.
Compensation of Employees (real) was -0.4% and compensation of Employees (nominal) was 0.7% (changes from the previous quarter (seasonally adjusted)).
Quartely Estimates of GDP: Jan. ~Mar. 2022 (The 1st Preliminary Estimates) Growth rate of GDP from the previous Quarters(seasonally adjusted) Contributions of Domestic Demand and External Demand to Changes in GDP
The 11th Longitudinal Survey of Newborns in the 21st Century (2010 Cohort)
May 18, released by the Ministry of Health, Labour and Welfare
The percentage of mothers with work reached 79.3% in the 11th survey (5th grade of primary school), 8.5 point higher as compared to the 11th survey of the 2001 cohort.
Indices of Industrial Production (Revised Report for March 2022)
May 18, released by the Ministry of Economy, Trade and Industry![]()
The index of industrial production (seasonally adjusted, 2015=100) was 96.5, increased by 0.3% from the previous month.
Consumer Price Index Japan (April)
May 20, released by the Ministry of Internal Affairs and Communications
The consumer price index for Japan in April 2022(preliminary) was 101.5(2020=100), up 2.5% from the previous year. All items, less fresh food, the comprehensive index was 101.4, up 2.1% from the previous year. All items, less fresh food and energy, the comprehensive index was 99.9, up 0.8% from the previous year.
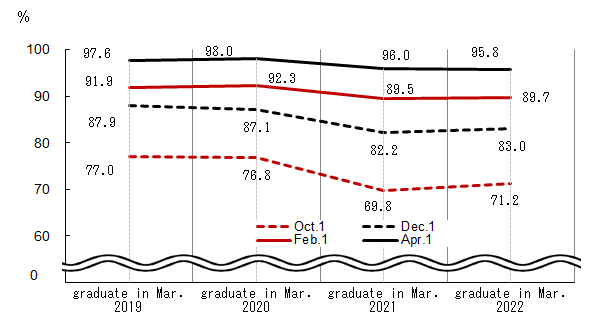
Survey on Situation of Preliminary Job Offers for New Graduate in Mar.2022 (University, etc.) (April 1, 2022)
May 20, released by the Ministry of Health, Labour and Welfare and the Ministry of Education, Culture, Sports, Science and Technology
The ratio of final-year university students who got an official job offer to applicants was 95.8%, decreased by 0.2 point from the same period a year earlier.
Trend in the percentage of final-year university students with official job offer
Survey on Situation of Preliminary Job Offers for New Senior High School Graduates (End of March, 2022)
May 20, released by the Ministry of Education, Culture, Sports, Science and Technology
The ratio of final-year senior high school students with preliminary job offers at the end of March, 2022, was 97.9%.
Monthly Labour Survey (Final Report in March and FY2021)
May 24, released by the Ministry of Health, Labour and Welfare![]()
Total amount of cash earnings increased by 2.0% and contractual cash earnings increased by 1.2% (full-time employees 1.3%, part-time employees 1.5%) from a year earlier.
Special cash earnings increased by 13.9% from a year earlier. Scheduled cash earnings increased by 1.0% and non-scheduled cash earnings increased by 4.2% from a year earlier. Real wage (total cash earnings) increased by 0.6% from a year earlier and real wage (contractual cash earnings) decreased by 0.2% from a year earlier.
Total hours decreased by 1.1%, scheduled hours worked decreased by 1.5% from a year earlier and non-scheduled hours worked increased by 3.8% from a year earlier.
Non-scheduled hours worked by manufacturing industry workers increased by 2.0% from the previous month (seasonally adjusted).
Total amount of cash earnings in FY2021 increased by 0.7% and contractual cash earnings increased by 0.8% (regular employees 1.1%, part-time workers 0.9%) from a year earlier.
Special cash earnings unchanged from a year earlier. Scheduled cash earnings increased by 0.4% and non-scheduled cash earnings increased by 7.1%. Real wage (total cash earnings) increased by 0.5% and real wage (contractual cash earnings) increased by 0.6% from the previous year.
Total hours increased by 1.0%, scheduled hours worked increased by 0.5% from a year earlier and non-scheduled hours worked increased by 8.2% from a year earlier.
Indexes of Business Conditions March 2022(Revision of the Preliminary Release)
May 25, released by the Cabinet Office
The Coincident Index of Composite Index (CI, revised figures, 2015=100) in March was 97.5, an increase of 0.7 point. And 3 months backward moving average increased by 0.20 point, and 7 months backward moving average increased by 0.67 point. So the Assessment of Coincident Index was "Improving".
The Leading Index was 100.8, an increase of 0.7 point, and the Lagging Index was 95.4, an increase of 0.2 point.
Survey on Supply and Demand of Construction Labor
May 25, released by the Ministry of Land, Infrastructure, Transport and Tourism
Consumer Price Index Ku-area of Tokyo (May) (preliminary)
May 27, released by the Ministry of Internal Affairs and Communications
The consumer price index for Ku-area of Tokyo in May 2022(preliminary) was 101.8(2020=100), up 2.4% from the previous year. All items, less fresh food, the comprehensive index was101.5, up 1.9% from the previous year. All items, less fresh food and energy, the comprehensive index was 100.4, up 0.9% from the previous year.
2020 Population Census Basic Complete Tabulation on Labour Force
May 27, released by the Ministry of Internal Affairs and Communications
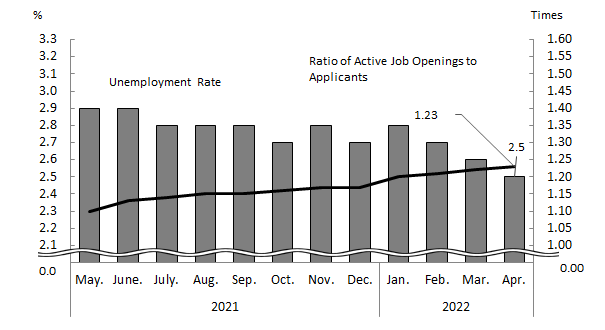
Labour Force Survey (April)
May 31, released by the Ministry of Internal Affairs and Communications
The unemployment rate (seasonally adjusted) was 2.5%, decreased by 0.1 point from the previous month. That for men was 2.8%, increased by 0.1point from the previous month and that for women was 2.2%, decreased by 0.2 point from the previous month.
The number of unemployed persons (seasonally adjusted) was 1.76 million, decreased by 30 thousand from the previous month.
The number of employees was 60.50 million, increased by 610 thousand from the previous year.
Among them, the number of regular employee was 36.51 million, increased by 510 thousand from the previous year and the number of non-regular employee was 20.70 million, increased by 210 thousand from the previous year.
Employment Referrals for General Workers (April)
May 31, released by the Ministry of Health, Labour and Welfare![]()
Active job openings-to-applicants ratio (seasonally adjusted) was 1.23, increased by 0.01 point from the previous month.
The number of monthly active job openings (person(s)) (seasonally adjusted) was increased by 0.9% from the previous month and the number of monthly active applications (person(s)) (seasonally adjusted) was decreased by 0.1% from the previous month.
New job openings-to-applicants ratio (seasonally adjusted) was 2.19, increased by 0.03 point from the previous month.
Active job openings-to-applicants ratio for regular staff (seasonally adjusted) was 0.97, increased by 0.03 point from the previous month.
Trend in Unemployment Rate and Ratio of Active Job
Openings to Applicants (seasonally adjusted)
Survey on Industrial Accidents 2021 (Survey of establishments (with 100 employees or more) and survey of general construction)
May 31, released by Ministry of Health, Labour and Welfare
Frequency rate (Frequency of occurrence of industrial accidents) is 2.09 (1.95 in the previous year). Severity rate (Level of severity of industrial accidents) is 0.09 (0.09 in the previous year).
Average number of working days lost per one casualty is 41.0 days (44.5days in the previous year).
Note: The frequency rate is the number of casualties in industrial accidents per 1 million total hours actually worked, indicating the frequency of occurrence of accidents.
The severity rate is the number of working days lost per 1,000 total actual working hours, indicating the severity of the accidents.
2021 Economic Census for Business Activity
May 31, released by the Ministry of Internal Affairs and Communications
Indices of Industrial Production (Preliminary Report for April 2022)
May 31, released by the Ministry of Economy, Trade and Industry![]()
The index of industrial production (seasonally adjusted, 2015=100) was 95.2, decreased by 1.3% from the previous month. According to the Survey of Production Forecast in Manufacturing, Production is expected to increase in May and June.
Other Reports
Monthly Economic Report (May 2022)
May 25, released by the Cabinet Office![]()
The Japanese economy shows movements of picking up. (In the previous month, “The Japanese economy shows movements of picking up as the severe situation due to the Novel Coronavirus is easing”)
- Private consumption shows movements of picking up recently. (The same as the previous month)
- Business investment shows movements of picking up. (The same as the previous month)
- Exports are almost flat. (The same as the previous month)
- Industrial production shows movements of picking up. (The same as the previous month)
- Corporate profits are improving as a whole, although some weaknesses remain in non-manufacturers due to the influence of the infectious disease. Firms' judgments on current business conditions appear to be pausing for picking up. (The same as the previous month)
- The employment situation shows movements of picking up. (In the previous month, “The employment situation shows picking up in some components such as job offers, while weakness remains due to the influence of the infectious disease.”)
- Consumer prices have been rising recently. (In the previous month, “Consumer prices are rising moderately recently”)
White Paper on Manufacturing Industries (Monodzukuri) 2022
May 31, released by Ministry of Economy, Trade and Industry
Ministry of Health, Labour and Welfare
Ministry of Education, Culture, Sports, Science and Technology
| To view PDF files, you will need Adobe Acrobat Reader Software installed on your computer.The Adobe Acrobat Reader can be downloaded from this banner. |
