
Recent Statistical Survey Reports, February 2022
Statistical Survey Reports
Survey on Public Assistance Recipients (November)
February 2, released by the Ministry of Health, Labour and Welfare
The number of welfare recipients in November was 2,039,439 and the number of households of welfare recipients was 1,643,782.
Indexes of Business Conditions December 2021 (Preliminary Release)
February 7, released by the Cabinet Office
The Coincident Index of Composite Index (CI, revised figures, 2015=100) in December was 92.6, a decrease of 0.2 point. And 3 months backward moving average increased by 1.30 point, and 7 months backward moving average increased by 0.03 point. So the Assessment of Coincident Index was "Weakening" (the same as the previous month)
The Leading Index was 104.3, an increase of 0.4 point, and the Lagging Index was 94.2, an increase of 0.8 point.
February 25 Indexes of Business Conditions December 2021(Revision of the Preliminary Release
Family Income and Expenditure Survey (December, 2021 Yearly Average)
February 8, released by the Ministry of Internal Affairs and Communications![]()
The average monthly income for a worker’s households with 2 or more family members was up 4.6% in real terms from the previous year. The change over the year of wages & salaries was up 1.4% in real terms from the previous year (household heads: 2.1% in real terms, spouse of household: 3.0% in real terms).
The average of consumption expenditures for a worker’s household with 2 or more family members was up 2.2% in real terms from the previous year.
The yearly average of monthly income for a worker’s households with 2 or more family members was down 0.4% in real terms and the yearly average of monthly consumption expenditures was up 1.5% from the previous year.
Monthly Labour Survey (Provisional Report in December and 2021)
February 8, released by the Ministry of Health, Labour and Welfare![]()
Total amount of cash earnings unchanged and contractual cash earnings increased by 0.5% (full-time employees 0.8%, part-time employees 1.5%) from a year earlier.
Special cash earnings decreased by 0.9% from a year earlier. Scheduled cash earnings increased by 0.2% and non-scheduled cash earnings increased by 4.8% from a year earlier. Real wage (total cash earnings) decreased by 2.2% from a year earlier and real wage (contractual cash earnings) decreased by 1.4% from a year earlier.
Total hours increased by 1.1%, scheduled hours worked increased by 0.8% and non-scheduled hours worked increased by 5.1% from a year earlier.
Non-scheduled hours worked by manufacturing industry workers increased by 1.5% from the previous month (seasonally adjusted).
Total amount of cash earnings in 2021 increased by 0.3% and contractual cash earnings increased by 0.5% (regular employees 0.8%, part-time workers 0.2%) from a year earlier.
Special cash earnings decreased by 0.7% from a year earlier. Scheduled cash earnings increased by 0.3% and non-scheduled cash earnings increased by 3.8%. Real wage (total cash earnings) unchanged and real wage (contractual cash earnings) increased by 0.2% from the previous year.
Total hours increased by 0.6%, scheduled hours worked increased by 0.4% and non-scheduled hours worked increased by 5.1% from a year earlier.
February 24 Monthly Labour Survey (Final Report in December)
National Accounts (The 1st Preliminary Estimates Oct.-Dec.2021)
February 15, released by the Cabinet Office![]()
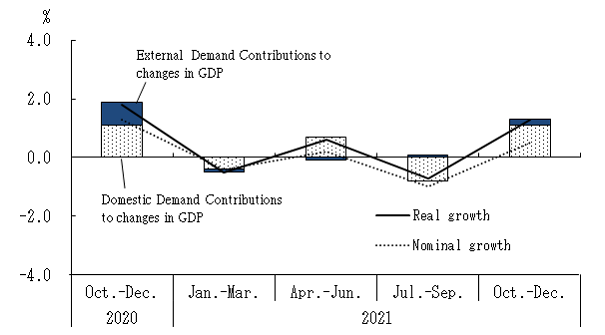
Real GDP (Gross Domestic Product) growth rate (Seasonally Adjusted) at Oct.-Dec.2021 was 1.3% (5.4% on annual basis). Of real GDP growth rate, 1.1% was contributed by domestic demand and 0.2% by external demand. Compensation of Employees (real) was 0.3% and compensation of Employees (nominal) was -0.3% (changes from the previous quarter (seasonally adjusted)).
Quartely Estimates of GDP: Oct. ~Dec. 2021(The 1st Preliminary Estimates)
Growth rate of GDP from the previous Quarters(seasonally adjusted)
Contributions of Domestic Demand and External Demand to Changes in GDP
Labor Force Survey: Detailed Tabulation (Oct.-Dec. 2021 and 2021)
February 15, released by the Ministry of Internal Affairs and Communications![]()
Of the total 56.27 million employee (excl. executive of company or corporation) (average, in the Oct. - Dec. 2021), the number of the regular employees increased by 140 thousand from the previous year to 35.42 million and the number of non-regular employees was 20.85 million, decreased by 240 thousand from the previous year.
Of the total 56.20 million employee (excl. executive of company or corporation) (average, in 2021), the number of the regular employees increased by 260 thousand from the previous year to 35.55 million and the number of non-regular employees was 20.64 million, decreased by 260 thousand from the previous year.
Indices of Industrial Production (Revised Report for December 2021)
February 15, released by the Ministry of Economy, Trade and Industry![]()
The index of industrial production (seasonally adjusted, 2015=100) was 96.5, decreased by 1.0% from the previous month.
Consumer Price Index Japan (January) (preliminary)
February 18, released by the Ministry of Internal Affairs and Communications
The consumer price index for Japan in January 2022(preliminary) was 100.3(2020=100), up 0.5% from the previous year. All items, less fresh food, the comprehensive index was 100.1, up 0.2% from the previous year. All items, less fresh food and energy, the comprehensive index was 99.0, down 1.1% from the previous year.
Survey on Situation of Preliminary Job Offers for New Senior High School Graduates (End of December, 2021)
February 18, released by the Ministry of Education, Culture, Sports, Science and Technology
The ratio of final-year senior high school students with preliminary job offers at the end of December, 2021, was 91.4%.
Monthly Labour Survey (Final Report in December and 2021)
February 24, released by the Ministry of Health, Labour and Welfare![]()
Total amount of cash earnings decreased by 0.4% and contractual cash earnings increased by 0.4% (full-time employees 0.7%, part-time employees 1.5%) from a year earlier.
Special cash earnings decreased by 1.1% from a year earlier. Scheduled cash earnings increased by 0.1% and non-scheduled cash earnings increased by 5.2%. Real wage (total cash earnings) decreased by 2.3% from a year earlier and real wage (contractual cash earnings) decreased by 1.5% from a year earlier.
Total hours increased by 1.1%, scheduled hours worked increased by 0.7% and non-scheduled hours worked increased by 5.1% from a year earlier.
Non-scheduled hours worked by manufacturing industry workers increased by 2.2% from the previous month (seasonally adjusted).
Total amount of cash earnings in 2021 increased by 0.3% and contractual cash earnings increased by 0.5% (regular employees 0.8%, part-time workers 0.2%) from a year earlier.
Special cash earnings decreased by 0.8% from a year earlier. Scheduled cash earnings increased by 0.3% and non-scheduled cash earnings increased by 3.9%. Real wage (total cash earnings) unchanged and real wage (contractual cash earnings) increased by 0.2% from the previous year.
Total hours increased by 0.6%, schedules hours worked increased by 0.4% and non-scheduled hours worked increased by 5.1% from a year earlier.
Indexes of Business Conditions December 2021(Revision of the Preliminary Release)
February 25, released by the Cabinet Office
The Coincident Index of Composite Index (CI, revised figures, 2015=100) in December was 92.7, a decrease of 0.1 point. And 3 months backward moving average increased by 1.34 point, and 7 months backward moving average increased by 0.04 point. So the Assessment of Coincident Index was “Weakening” (the same as the previous month)
The Leading Index was 104.8, an increase of 0.9 point, and the Lagging Index was 94.1, an increase of 0.8 point.
Consumer Price Index Ku-area of Tokyo (February) (preliminary)
February 25, released by the Ministry of Internal Affairs and Communications
The consumer price index for Ku-area of Tokyo in February 2022(preliminary) was 100.7(2020=100), up 1.0% from the previous year. All items, less fresh food, the comprehensive index was 100.4, up 0.5% from the previous year. All items, less fresh food and energy, the comprehensive index was 99.6, down 0.6% from the previous year.
Survey on Supply and Demand of Construction Labor
February 25, released by the Ministry of Land, Infrastructure, Transport and Tourism
Indices of Industrial Production (Preliminary Report for January 2022)
February 28, released by the Ministry of Economy, Trade and Industry![]()
The index of industrial production (seasonally adjusted, 2015=100) was 95.2, decreased by 1.3% from the previous month. According to the Survey of Production Forecast in Manufacturing, Production is expected to increase in February and March.
The 23nd Life Tables (2020) (Complete Life Tables)
March 2, released by Ministry of Health, Labour and Welfare![]()
The average life expectancy of Japanese men was 81.56 years, an increase of 0.81 years from the 22th (2015). That of women was 87.71 years, an increase of 0.73 years from the 22th (2015).
Survey on Public Assistance Recipients (December)
March 2, released by the Ministry of Health, Labour and Welfare
The number of welfare recipients in December was 2,040,211 and the number of households of welfare recipients was 1,644,884.
Labour Force Survey (January)
March 4, released by the Ministry of Internal Affairs and Communications
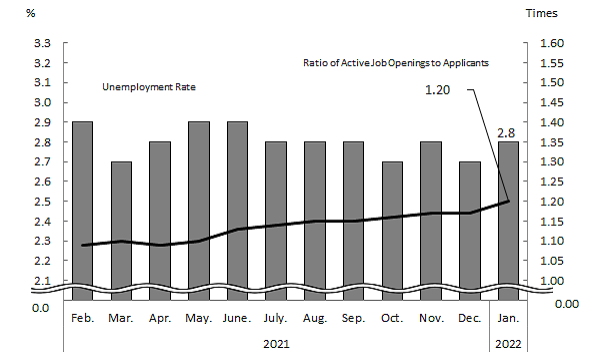
The unemployment rate (seasonally adjusted) was 2.8%, increased by 0.1 point from the previous month. That for men was 3.0%, increased by 0.1 point from the previous month and that for women was 2.4%, unchanged from the previous month.
The number of unemployed persons (seasonally adjusted) was 1.91 million, increased by 40 thousand from the previous month.
The number of employees was 59.77 million, decreased by 350 thousand from the previous year.
Among them, the number of regular employee was 35.54 million, decreased by 270 thousand from the previous year and the number of non-regular employee was 20.67 million, unchanged from the previous year.
Employment Referrals for General Workers (January)
March 4, released by the Ministry of Health, Labour and Welfare![]()
Active job openings-to-applicants ratio (seasonally adjusted) was 1.20, increased by 0.03 point from the previous month.
The number of monthly active job openings (person(s)) (seasonally adjusted) was increased by 2.6% from the previous month and the number of monthly active applications (person(s)) (seasonally adjusted) was increased by 0.7% from the previous month.
New job openings-to-applicants ratio (seasonally adjusted) was 2.16, decreased by 0.03 point from the previous month.
Active job openings-to-applicants ratio for regular staff (seasonally adjusted) was 0.91, increased by 0.01 point from the previous month.
Trend in Unemployment Rate and Ratio of Active Job
Openings to Applicants (seasonally adjusted)
Other Reports
Monthly Economic Report (February)
February 18, released by the Cabinet Office![]()
The Japanese economy continues to show movements of picking up, although some weaknesses are seen as a severe situation due to the Novel Coronavirus remains. (In the previous month, “The Japanese economy shows movements of picking up recently as the severe situation due to the Novel Coronavirus is gradually easing”)
- Private consumption appears to be pausing for picking up recently. (In the previous month, “Private consumption is picking up recently”)
- Business investment shows movements of picking up. (In the previous month, “Business investment appears to be pausing for picking up”)
- Exports are almost flat. ((The same as the previous month)
- Industrial production shows movements of picking up. (The same as the previous month)
- Corporate profits are picking up, although some weaknesses remain in non-manufacturers due to the influence of the infectious disease. Firms' judgments on current business conditions show movements of picking up. (The same as the previous month)
- Employment situation shows picking up in some components such as job offers, while weakness remains due to the influence of the infectious disease. (The same as the previous month)
| To view PDF files, you will need Adobe Acrobat Reader Software installed on your computer.The Adobe Acrobat Reader can be downloaded from this banner. |
