
Recent Statistical Survey Reports, March 2018
Statistical Survey Reports
Survey on Public Assistance Recipients (December)
March 7, released by the Ministry of Health, Labour and Welfare
The number of welfare recipients in December was 2,123,290 and the number of households of welfare recipients was 1,642,614.
Indexes of Business Conditions January 2018 (Preliminary Release)
March 7, released by the Cabinet Office
The Coincident Index of Composite Index (CI, revised figures, 2010=100) in January was 114.0, a decrease of 5.7 point. And 3 months backward moving average decreased by for 0.80point, and 7 months backward moving average decreased for 0.36point. So the Assessment of Coincident Index was “Improving” (The same as the previous month)
The Leading Index was 104.8, a decrease of 1.8 point, and the Lagging Index was 119.5, an increase of 0.5 point.
National Accounts (The 2nd Preliminary Estimates Oct.-Dec. 2017)
March 8, released by the Cabinet Office![]()
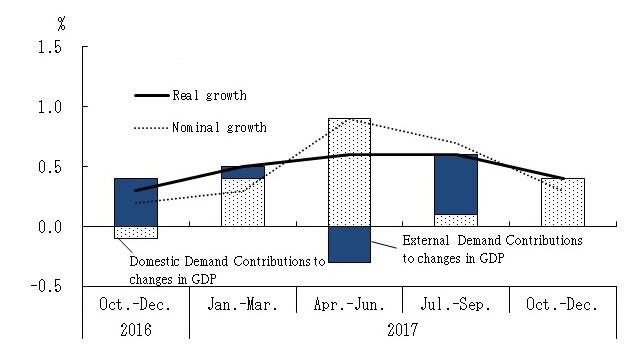
Real GDP (Gross Domestic Product) growth rate (Seasonally Adjusted) at Oct.-Dec.2017 was 0.4% (1.6% on annual basis). Of real GDP growth rate, 0.4% was contributed by domestic demand and -0.0% by external demand. Compensation of Employees (real) was -0.4% and compensation of Employees (nominal) was 0.2% (changes from the previous quarter (seasonally adjusted)).
Quartely Estimates of GDP: Oct. ~Dec. 2017 (The 2nd Preliminary Estimates)
Growth rate of GDP from the previous Quarters(seasonally adjusted)
Contributions of Domestic Demand and External Demand to Changes in GDP
Monthly Labour Survey (Provisional Report in January)
March 9, released by the Ministry of Health, Labour and Welfare
Total amount of cash earnings increased by 0.7% and contractual cash earnings increased by 0.3% (full-time employees 0.5%, part-time employees 1.1%) from a year earlier.
Special cash earnings increased by 9.3% from a year earlier. Scheduled cash earnings increased by 0.2% and non-scheduled cash earnings unchanged. Real wage (total cash earnings) decreased by 0.9% from a year earlier and real wage (contractual cash earnings) decreased by 1.4% from a year earlier.
Non-scheduled hours worked by manufacturing industry workers at business establishments with 5 or more employees decreased by 1.5% from the previous month (seasonally adjusted).
Family Income and Expenditure Survey (January)
March 9, released by the Ministry of Internal Affairs and Communications
The average monthly income for a worker’s household with 2 or more family members was decreased by 1.5% in real terms from the same month a year before.
The change over the year of wages & salaries was -1.9% in real terms from the previous year (household heads: -4.3% in real terms, spouse of household: 6.3% in real terms).
The average of consumption expenditures for a worker’s household with 2 or more family members was up 1.7% in real terms from the previous year.
Revised forms of account books have been introduced to half of the sample households on January 2018, therefore results including "Change over th year" and "Contribution" in data tables might have gaps from the figures by the previous survey schedules.
To resolve this discontinuity, "discontinuity-adjusted figures" are calculated by "Inverse-Probability-Weighting" using "propensity score", for valid comparison with results of previous years.
Survey on Situation of Preliminary Job Offers for New Graduate (Senior and Junior High School) (End of January, 2018)
March 16, released by the Ministry of Health, Labour and Welfare
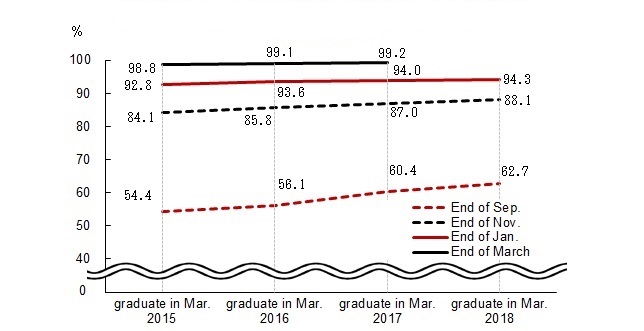
The ratio of final-year senior high school students with preliminary job offers was 94.3%, an increase of 0.3 point from the same period of the previous year.
The ratio of job openings to applicants for final-year senior high school students was 2.48, 0.29 point higher than the same period of the previous year.
The ratio of job openings to applicants for final-year junior high school students was 1.89, 0.18 point higher than the same period of the previous year.
Trend in the percentage of final-year high school students
with official job offer
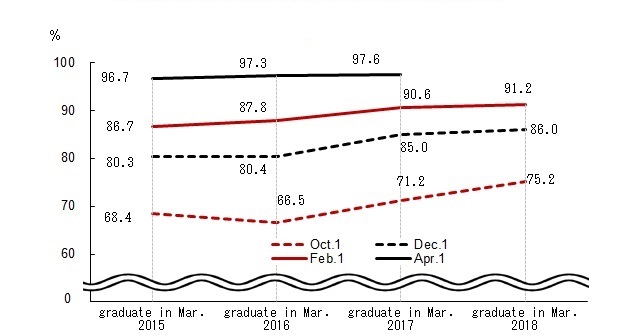
Survey on Situation of Preliminary Job Offers for New Graduate in Mar.2018 (University, etc.) (February 1, 2018)
March 16, released by the Ministry of Health, Labour and Welfare and the Ministry of Education, Culture, Sports, Science and Technology
The ratio of final-year university students who got an official job offer to applicants was 91.2%, increased by 0.6 point from the same period a year earlier.
Trend in the percentage of final-year university students
with official job offer
Indexes of Business Conditions January 2017 (Revision of the Preliminary Release)
March 20, released by the Cabinet Office
The Coincident Index of Composite Index (CI, revised figures, 2010=100) in January was 114.9, a decrease of 4.8 point. And 3 months backward moving average decreased for 0.50 point, and 7 months backward moving average decreased for 0.23 point. So the Assessment of Coincident Index was “Improving” (The same as the previous month)
The Leading Index was 105.6, decreased by 1.2%, and the Lagging Index was 119.4, an increase of 0.5 point.
Consumer Price Index Japan (February)
March 23, released by the Ministry of Internal Affairs and Communications
The consumer price index for Japan in February 2018 was 101.3(2015=100), up 1.5% over the year. All items, less fresh food, the comprehensive index was 100.6, up 1.0% from the previous year. All items, less fresh food and energy, the comprehensive index was 100.8, up 0.5% from the previous year.
Special Report on the Longitudinal Survey of Middle and Elderly Persons
March 23, released by the Ministry of Health, Labour and Welfare
Survey on Supply and Demand of Construction Labor
March 26, released by the Ministry of Land, Infrastructure, Transport and Tourism
Survey on Labor Economic Trend (February 2018)
March 27, released by the Ministry of Health, Labour and Welfare
By the judgment of employment surplus or shortage DI as of February 1, 2018, regarding the trend of the sense of employment surplus or shortage, in the total of industries surveyed, regular staff, etc. accounted for 44 and the DI shows shortage for 27 consecutive terms. And, that of part-time workers accounted for 32 and the DI shows shortage for 34 consecutive terms.
Indices of Industrial Production (February)
March 30, released by the Ministry of Economy, Trade and Industry![]()
The index of industrial production (seasonally adjusted, 2010=100) increased by 4.1% from the previous month. According to the Survey of Production Forecast in Manufacturing, Production is expected to increase in March and April.
Consumer Price Index Ku-area of Tokyo (March) (preliminary)
March 30, released by the Ministry of Internal Affairs and Communications
The consumer price index for Ku-area of Tokyo in March 2018(preliminary) was 100.5(2015=100), up 1.0% from the previous year. All items, less fresh food, the comprehensive index was 100.2, up 0.8% from the previous year. All items, less fresh food and energy, the comprehensive index was 100.7, up 0.5% from the previous year.
Labour Force Survey (February)
March 30, released by the Ministry of Internal Affairs and Communications
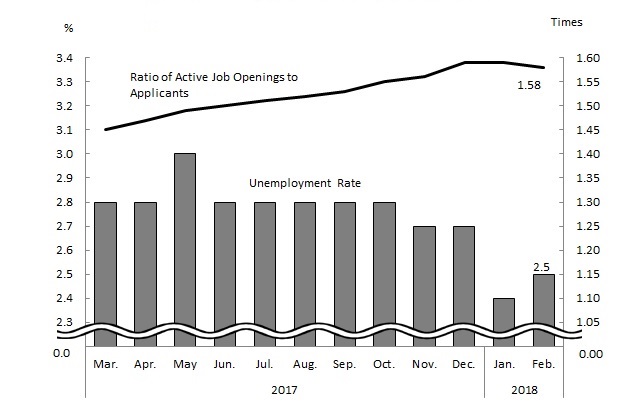
The unemployment rate (seasonally adjusted) was 2.5%, increased by 0.1point from the previous month. That for men was 2.6%, increased by 0.1 point and that for women was 2.3%, increased by 0.1 point from the previous month.
The number of unemployed persons (seasonally adjusted) was 1.69million, increased by 90 thousand from the previous month.
The number of employees was 58.75 million, increased by 1.21million from the previous year.
Among them, the number of regular employee was 34.30 million, increased by 330 thousand from the previous year and the number of non-regular employee was 21.20 million, increased by 1.15million from the previous year.
Employment Referrals for General Workers (February)
March 30, released by the Ministry of Health, Labour and Welfare![]()
Active job openings-to-applicants ratio (seasonally adjusted) was 1.58, decreased by 0.01point from the previous month.
The number of monthly active job openings (person(s)) (seasonally adjusted) was decreased by 1.1% from the previous month and the number of monthly active applications (person(s)) (seasonally adjusted) was decreased by 0.3% from the previous month.
New job openings-to-applicants ratio (seasonally adjusted) was 2.30, decreased by 0.04point from the previous month.
Active job openings-to-applicants ratio for regular staff (seasonally adjusted) was 1.07, unchanged from the previous month.
Trend in Unemployment Rate and Ratio of Active Job
Openings to Applicants (seasonally adjusted)
Basic Survey on Human Resource Development (FY2017)
March 30, released by Ministry of Health, Labour and Welfare
The proportion of workers who undertook self-development was 42.9% for regular employees and 20.2% for non-regular employees.
Report on Worker Dispatching Business (June 1, 2017)
March 30 released by the Ministry of Health, Labour and Welfare
The number of dispatched workers was about 1.56 million (an increase of 19.4% from the report in the previous year).
Report on Labour supply projects (FY2016)
March 30 released by the Ministry of Health, Labour and Welfare
The number of labour unions supplying with labours was 95 (an increase of 3 union from the previous fiscal year).
Report on Employment Business (FY2016)
March 30 released by the Ministry of Health, Labour and Welfare
Report on Worker Dispatching Business (FY2016)
March 30 released by the Ministry of Health, Labour and Welfare
Other Reports
Monthly Economic Report (March)
March 16, released by the Cabinet Office![]()
The Japanese economy is recovering at a moderate pace. (The same as the previous month)
- Private consumption is in picking up. (The same as the previous month)
- Business investment is increasing moderately. (The same as the previous month)
- Exports are picking up. (The same as the previous month)
- Industrial production is increasing moderately. (The same as the previous month)
- Corporate profits is improving. Firms' judgment on current business conditions is improving. (The same as the previous month)
- The employment situation is improving steadily. (The same as the previous month)
- Consumer prices are rising moderately in recent months. (In the previous month, “Consumer prices are flat.”)
| To view PDF files, you will need Adobe Acrobat Reader Software installed on your computer.The Adobe Acrobat Reader can be downloaded from this banner. |
