
Recent Statistical Survey Reports, May 2017
Statistical Survey Reports
Monthly Labour Survey (Provisional Report in March)
May 9, released by the Ministry of Health, Labour and Welfare
Total amount of cash earnings decreased by 0.4% and contractual cash earnings decreased by 0.2% (full-time employees -0.2%, part-time employees -1.7%) from a year earlier.
Special cash earnings decreased by 3.6% from a year earlier. Scheduled cash earnings decreased by 0.1% and non-scheduled cash earnings decreased by 1.7%. Real wage (total cash earnings) decreased by 0.8% from a year earlier and real wage (contractual cash earnings) decreased by 0.5% from a year earlier.
Non-scheduled hours worked by manufacturing industry workers at business establishments with 5 or more employees decreased by 1.4% from the previous month (seasonally adjusted).
Labor Force Survey: Detailed Tabulation (Jan.-Mar. 2017)
May 9, released by the Ministry of Internal Affairs and Communications
Of the total 54.02 million employed persons (average, in the Jan. - Mar. 2017), the number of the regular employees (excluding board members) increased by 470 thousand from the previous year to 33.85 million. The number of non-regular employees of the employees was 20.17 million, increased by 40 thousand from the previous year.
Of the total 1.91 million unemployed persons, the number of persons who had been unemployed for 1 year or more was 700 thousand, a decrease of 120 thousand from the previous year.
Survey on Public Assistance Recipients (February)
May 10, released by the Ministry of Health, Labour and Welfare
The number of welfare recipients in February was 2,141,881 and the number of households of welfare recipients was 1,638,944.
Indexes of Business Conditions March 2017 (Preliminary Release)
May 10, released by the Cabinet Office
The Coincident Index of Composite Index (CI, revised figures, 2010=100) in March was 114.6, a decrease of 0.6 point. And 3 months backward moving average unchanged, and 7 months backward moving average increased for 0.42 point. So the Assessment of Coincident Index was “Improving” (The same as the previous month)
The Leading Index was 105.5, an increase of 0.8 point, and the Lagging Index was 117.7, an increase of 1.8 point.
Comprehensive Survey on Wages 2016
May 12, released by Central Labour Relations Commission, JAPAN
National Accounts (The 1st Preliminary Estimates Jan.-Mar.2017)
May 18, released by the Cabinet Office![]()
Real GDP (Gross Domestic Product) growth rate (Seasonally Adjusted) at Jan.-Mar.2017 was 0.5% (2.2% on annual basis). Of real GDP growth rate, 0.4% was contributed by domestic demand and 0.1% by external demand.
Compensation of Employees (real) was -0.1% and compensation of Employees (nominal) was -0.2% (changes from the previous quarter (seasonally adjusted)).
Quartely Estimates of GDP: Jan. ~Mar. 2016 (The 1st Preliminary Estimates)
Growth rate of GDP from the previous Quarters(seasonally adjusted)
Contributions of Domestic Demand and External Demand to Changes in GDP
Survey on Situation of Preliminary Job Offers for New Graduate (Senior and Junior High School) (End of March, 2017)
May 19, released by the Ministry of Health, Labour and Welfare
The ratio of final-year senior high school students with preliminary job offers was 99.2%, an increase of 0.1 point from the same period of the previous year.
The ratio of job openings to applicants for final-year senior high school students was 2.23, 0.19 point higher than the same period of the previous year.
The ratio of job openings to applicants for final-year junior high school students was 2.35, 0.28 point lower than the same period of the previous year.
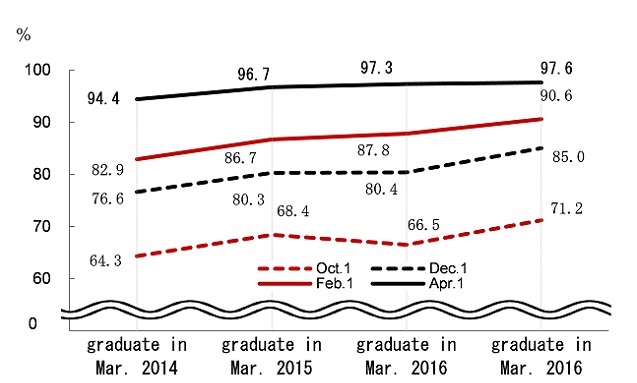
Survey on Situation of Preliminary Job Offers for New Graduate in Mar.2017 (University, etc.) (April 1, 2017)
March 19, released by the Ministry of Health, Labour and Welfare and the Ministry of Education, Culture, Sports, Science and Technology
The ratio of final-year university students who got an official job offer to applicants was 97.6%, increased by 0.3 point from the same period a year earlier.
Trend in the percentage of final-year university students
with official job offer
Survey on Situation of Preliminary Job Offers for New Senior High School Graduates (End of March, 2017)
May 19, released by the Ministry of Education, Culture, Sports, Science and Technology
The ratio of final-year senior high school students with preliminary job offers at the end of March, 2017, was 98.0%, an increase of 0.3 point from the previous year.
Trend in the percentage of final-year high school students
with official job offer
Status on Industrial accidents of death cases and significant accidents in 2016
May 19, released by the Ministry of Health, Labour and Welfare
Monthly Labour Survey (Final Report in March and FY2016)
May 23, released by the Ministry of Health, Labour and Welfare![]()
Total amount of cash earnings unchanged and contractual cash earnings decreased by 0.1% (full-time employees 0.1%, part-time employees -0.9%) from a year earlier.
Special cash earnings increased by 1.7% from a year earlier. Scheduled cash earnings decreased by 0.1% and non-scheduled cash earnings decreased by 0.6%. Real wage (total cash earnings) decreased by 0.3% and real wage (contractual cash earnings) decreased by 0.4% from a year earlier.
Non-scheduled hours worked by manufacturing industry workers at business establishments with 5 or more employees decreased by 1.4% from the previous month (seasonally adjusted).
Total amount of cash earnings in FY2016 increased by 0.4% and contractual cash earnings increased by 0.1% (full-time employees 0.4%, part-time employees -0.4%) from a year earlier.
Special cash earnings increased by 1.9% from a year earlier. Scheduled cash earnings increased by 0.2% and non-scheduled cash earnings decreased by 0.6%. Real wage (total cash earnings) increased by 0.4% from a year earlier and real wage (contractual cash earnings) increased by 0.1% from a year earlier.
The number of total hours worked in FY2016 decreased by 0.8% from the previous year.
The number of regular employees in FY2016 increased by 2.2% from the previous year. Among them, the number of full-time employees increased by 1.8% and the number of part-time employees increased by 2.9%.
Indexes of Business Conditions March 2017 (Revision of the Preliminary Release)
May 24, released by the Cabinet Office
The Coincident Index of Composite Index (CI, revised figures, 2010=100) in March was 114.4, a decrease of 0.8 point. And 3 months backward moving average decreased for 0.06 point, and 7 months backward moving average increased for 0.39 point. So the Assessment of Coincident Index was “Improving” (The same as the previous month)
The Leading Index was 105.5, an increase of 0.8 point, and the Lagging Index was 116.9, an increase of 0.9 point.
Survey on Supply and Demand of Construction Labor
May 25, released by the Ministry of Land, Infrastructure, Transport and Tourism
Consumer Price Index (April)
May 26, released by the Ministry of Internal Affairs and Communications
The consumer price index for Japan in April 2017 was 100.3(2015=100), up 0.4% over the year. All items, less fresh food, the comprehensive index was 100.1, up 0.3% from the previous year. All items, less fresh food and energy, the comprehensive index was 100.7, unchanged from the previous year.
The consumer price index for Ku-area of Tokyo in May 2017(preliminary) was 100.1(2015=100), up 0.2% over the year. All items, less fresh food, the comprehensive index was 100.0, up 0.1% over the year. All items, less fresh food and energy, the comprehensive index was 100.6, unchanged from the previous year.
Labour Force Survey (April)
May 30, released by the Ministry of Internal Affairs and Communications
The unemployment rate (seasonally adjusted) was 2.8%, unchanged from the previous month. That for men was 2.9%, increased by 0.1point and that for women was 2.6%, decreased by 0.1point from the previous month.
The number of unemployed persons (seasonally adjusted) was 1.86million, increased by 20 thousand from the previous month.
The number of employees was 57.57 million, increased by 570 thousand from the previous year.
Among them, the number of regular employee was 34.00 million, increased by 140 thousand from the previous year and the number of non-regular employee was 20.04 million, increased by 330 thousand from the previous year.
Employment Referrals for General Workers (April)
May 30, released by the Ministry of Health, Labour and Welfare![]()
Active job openings-to-applicants ratio (seasonally adjusted) was 1.48, increased by 0.03 point from the previous month.
The number of monthly active job openings (person(s)) (seasonally adjusted) was increased by 0.7% from the previous month and the number of monthly active applications (person(s)) (seasonally adjusted) was decreased by 1.6% from the previous month.
New job openings-to-applicants ratio (seasonally adjusted) was 2.13, unchanged from the previous month.
Active job openings-to-applicants ratio for regular staff (seasonally adjusted) was 0.97, increase by 0.03 point from the previous month.
Trend in Unemployment Rate and Ratio of Active Job
Openings to Applicants (seasonally adjusted)
Family Income and Expenditure Survey (April)
May 30, released by the Ministry of Internal Affairs and Communications
The average monthly income for a worker’s household with 2 or more family members was decreased by 2.2% in real terms from the same month a year before.
The change over the year of wages & salaries was -3.7% in real terms from the previous year (household heads: -3.0% in real terms, spouse of household: -5.9% in real terms).
The average monthly consumption expenditures for a worker’s household with 2 or more family members was decreased by 2.9% in real terms from the same month a year before.
Basic Survey of Gender Equality in Employment Management in FY2016 (Provisional Report)
May 30, released by the Ministry of Health, Labour and Welfare
The ratio of the child-care leave taken by female was 81.8 (an increase of 0.3point from the survey of FY2015) and that of male was 3.16% (an increase of 0.51point from the survey of FY2015).
Indices of Industrial Production (April)
May 31, released by the Ministry of Economy, Trade and Industry![]()
The index of industrial production (seasonally adjusted, 2010=100) increased by 4.0% from the previous month.
According to the Survey of Production Forecast in Manufacturing, Production is expected to decrease in May and increase in June.
2016 Economic Census for Business Activity (Preliminary Tabulation)
May 31, released by the Ministry of Internal Affairs and Communications and
the Ministry of Economy, Trade and Industry
Other Reports
Monthly Economic Report (May)
May 24, released by the Cabinet Office![]()
The Japanese economy is on a moderate recovery, while delayed improvement in part can be seen. (The same as the previous month)
- Private consumption remains in pickup as a whole. (The same as the previous month)
- Business investment picking up appears to be pausing. (The same as the previous month)
- Exports are picking up. (The same as the previous month)
- Industrial production is picking up. (The same as the previous month)
- Corporate profits is improving. Firms' judgment on current business conditions is improving. (The same as the previous month)
- The employment situation is improving. (The same as the previous month)
- Consumer prices are flat. (The same as the previous month)
Investing in Youth: Japan OECD REVIEW ON NEETS
| To view PDF files, you will need Adobe Acrobat Reader Software installed on your computer.The Adobe Acrobat Reader can be downloaded from this banner. |
