Recent Statistical Survey Reports, March 2009
Statistical Survey Reports
Indexes of Business Conditions (Preliminary Report for January)
Tuesday, March 10, released by the Cabinet Office
The Coincident Index of CI (Preliminary figures, 2005=100) in January was 89.6, a decrease of 2.6 points, 3 months backward moving average decreased for 6 consecutive months, a decrease of 2.63 points, and 7 months backward moving average decreased for 11 consecutive months, a decrease of 1.80 points. So the Assessment of Coincident Index was “Worsening”. The Leading Index was 77.1, a decrease of 2.3 points, and the Lagging Index was 92.1, a decrease of 1.2 points.
Survey on Labor Economic Trend (February)
Tuesday, March 10, released by the Ministry of Health, Labour and Welfare
By the judgment of employment surplus or shortage DI as of February 1, 2009, regarding the trend of the sense of employment surplus or shortage, in the total of industries surveyed, regular employees and part-time workers accounted for -11 (13 points the previous period) and -1 (14 points the previous period) points respectively. Both of DIs changed from the excess of shortage to the excess of surplus.
6th Follow-up Survey on adults in the 21st Century (Continuous Survey on the livelihoods of the Japanese citizens)
Wednesday, March 11, released by the Ministry of Health, Labour and Welfare
As for the ratio of men who were age 20-34 in 2002 and got married in these five years(2002-2007), by employment type, “regular employees”, “non-regular employees” and “unemployed” accounted for 24.0%, 12.1% and 9.0% respectively.
National Accounts (The 2nd Preliminary Estimates of Expenditure in Oct.-Dec.)
Thursday,
March 12, released by the Cabinet Office![]()
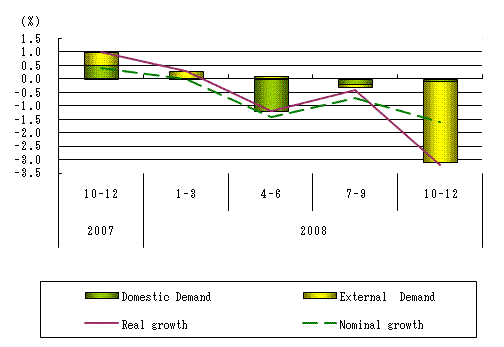
Real GDP (Gross Domestic Product) growth rate (Seasonally Adjusted) was -3.2% (-12.1% on annual basis), upwardly revised by 0.1 points (0.6 points on annual basis) for the 1st preliminary estimates.
Of real GDP growth rate, -0.1% was contributed by domestic demand and -3.0% by external demand.
Quartely Estimates of GDP(The 2nd Preliminary Estimates)
Growth rate of GDP from the previous Quarters Contribution of
Domestic Demand and External Demand to Changes in GDP
Survey on Situation of Preliminary Job Offers for New Graduate in Mar. 2009 (Senior and Junior High School) (End of January)
Friday, March 13, released by the Ministry of Health, Labour and Welfare
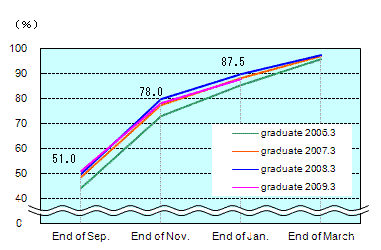
The ratio of final-year senior high school students with preliminary job offers was 87.5%, a decrease of 1.9 points from the previous year.
The ratio of job openings to applicants for final-grade senior high school students was 1.72, 0.07 points lower than the previous year.
The ratio of job openings to applicants for final-grade junior high school students was 0.97, 0.18 points lower than the previous year.
Trend in the percentage of final-year high school students
with official job offer
Survey on Situation of Preliminary Job Offers for New Graduate in Mar. 2009 (University, etc.) (February 1)
Friday, March 13, released by the Ministry of Health, Labour and Welfare
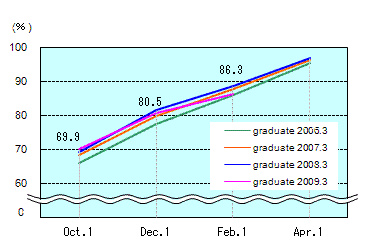
The ratio of final-year university students who got an official job offer to applicants was 86.3%, decreased by 2.4 points from the same period a year earlier.
That of final-year junior college students (female only) was 75.8%, decreased by 0.9 points from the same period a year earlier.
That of final-year technology college students (male only) was 99.0%, decreased by 0.6 points from the same period a year earlier.
That of final-year vocational school students was 78.8%, decreased by 2.8 points from the same period a year earlier.
Trend in the percentage of final-year university students
with official job offer
Basic Survey on Wage Structure (2008)
Wednesday, March 25, released by the Ministry of Health, Labour and Welfare
The average scheduled cash earnings for general employees was 299,100yen (average age 40.9, length of service 11.6 years), decreased by 0.7% from the previous year. The average scheduled cash earnings for men decreased by 0.9%from the previous year to 333,700yen (average age 41.7, length of service 13.1 years), and that for women increased by 0.4% from the previous year to 226,100yen (average age 39.1, length of service 8.6 years).
As for the wage by type of employment, the wage of regular employees was 316,500 yen (average age 40.4, length of service 12.5 years), that of non-regular employees was 194,800 yen (average age 43.8, length of service 6.3 years). By sex, the wage of regular employees for men decreased by 0.6% points from the previous year to 345,300 yen and that of non-regular employees for men decreased by 0.1% points to 224,000 yen. Regarding the wage for women, the former increased by 0.2% points to 243,900 yen, the latter increased by 1.0% points to 170,500 yen.
Hourly wages of part-time employees for men was 1,071yen (decreased by 1.3% from the previous year), that for women was 975yen (increased by 1.4% from the previous year).
Consumer Price Index (February)
Friday, March 27, released by the Ministry of Internal Affairs and Communications
The Consumer Price Index was 100.4, a decrease of 0.1% from the previous year. Omitting Fresh food, the comprehensive index was 100.4, unchanged from the previous year.
And in the ward -areas of Tokyo in March, the former accounted for 100.7, an increase of 0.2% from the previous year. Omitting Fresh food, the latter accounted for 100.7, an increase of 0.4% from the previous year.
Indices of Industrial Production (February)
Monday, March 30, released by the Ministry of Economy, Trade and Industry
The index of industrial production (seasonally adjusted) decreased by 9.4% from the previous month.
It decreased for 5 consecutive months.
According to the Survey of Production Forecast in Manufacturing, Production is expected to increase in March and April. The Synthetic judgment is “Industrial Production drops steeply.”
Labour Force Survey (February)
Tuesday, March 31, released by the Ministry of Internal Affairs and Communications
Report on Employment Service (February)
Tuesday, March 31, released by the Ministry of Health, Labour and Welfare
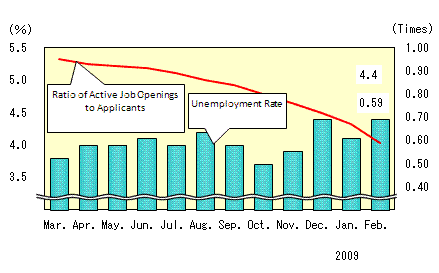
The unemployment rate (seasonally adjusted) was 4.4%, increased by 0.3 points from the previous month. That for men was 4.4%, increased by 0.2 points from the previous month, and that for women was 4.4%, increased by 0.3 points from the previous month.
The number of unemployed persons increased by 330 thousand from a year earlier to 2.99 million. It increased for 4 consecutive months.
The number of employees increased by 20 thousand from the previous month to 54.56 million. It increased for 2 consecutive months.
The ratio of active job openings to applicants (seasonally adjusted) was 0.59, decreased by 0.08 points from the previous month.
Trend in Unemployment Rate and Ratio of Active Job
Openings to Applicants
Family Income and Expenditure Survey (February)
Tuesday, March 31, released by the Ministry of Internal Affairs and Communications
The average monthly income for a worker’s household with 2 or more family members was 464,665 yen, decreased by 2.4% from the same month a year before.
With regard to the income contributing to increase - decrease rate, contribution of head of household’s income accounted for -2.44 %, partner’s income accounted for 0.89%.
Monthly Labour Survey (Preliminary Report in February / Year-end bonus)
Tuesday, March 31, released by the Ministry of Health, Labour and Welfare
Total amount of cash earnings (for business establishments with 5 or more employees) decreased by 2.7% from a year earlier, contractual cash earnings decreased by 2.4% from a year earlier.
Scheduled cash earnings decreased by 1.0%, non-scheduled cash earnings decreased by 18.5% from a year earlier. Real wage (total) decreased by 2.7% from a year earlier.
Non-scheduled hours worked by manufacturing industry workers at business establishments with 5 or more employees, seasonally adjusted decreased by 13.4% from the previous month.
The amount of year-end bonus in 2008(for business establishments with 5 or more employees) was 424,437yen, increased by 1.0% from the previous year. The ratio of number of business establishments which paid year- end bonus was 73.3%, decreased by 2.2% from a year earlier.
TANKAN (Short-Term Economic Survey of Enterprises) (March)
Wednesday,
April 1, released by the Bank of Japan(PDF:184KB)![]()
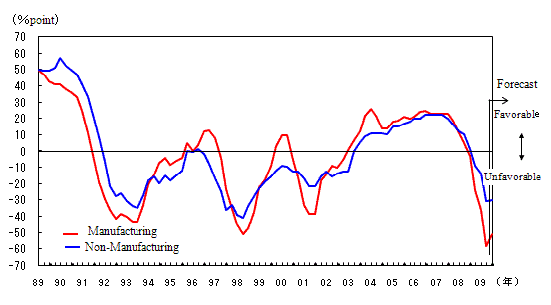
The Diffusion Index (DI) (“Favorable”- “Unfavorable”) for business conditions in large enterprises of the manufacturing was -58 (-24 in the previous quarter and forecast -51 in the coming quarter), and the non-manufacturing DI was -31 (-9 in the previous quarter and forecast -30 in the coming quarter), each Index also decreased substantially.
The Diffusion Index (DI) (“Excessive”- “Insufficient”) for employment conditions in large enterprises of all industries was 20 (1 in the previous quarter and forecast 19 in the coming quarter).
Business Sentiment (For Large Enterprises)
Other Reports
Monthly Economic Report (March)
Monday,
March 16, released by the Cabinet Office![]()
The economy is worsening rapidly while in a severe situation.
- Exports and Industrial production are decreasing very substantially.
- Corporate profits are decreasing very substantially and business investment is decreasing.
- The employment situation is getting worse rapidly.
- Private consumption is decreasing moderately.
Monthly Economic Labour Report (March)
Tuesday, March 24, released by the Ministry of Health, Labour and Welfare
In looking at the aspects of labor and economy, the employment situation is getting worse rapidly.
Actual Situation of Working Women in 2008
Thursday, March 26, released by the Ministry of Health, Labour and Welfare
The women labor force in Japan was 27.62 million (a decrease of 10 thousand from a previous year), and the labor force participation rate numbered 48.4% (a decrease of 0.1points from a previous year). Both number decreased for the first time in five years.
The labor participation rate for women with their age 30-34, which had been standing at the bottom of the shape of “M curve”, but this time, age 35-39 stand at the bottom for the first time since 1968 from which year the data become to be comparable. The labor participation rate with their age 35-39 increased by 0.6 points from the previous year to 64.9%, while that with their age 30-34 increased by 1.1 points from the previous year to 65.1%.
| To view PDF files, you will need Adobe Acrobat Reader Software installed on your computer.The Adobe Acrobat Reader can be downloaded from this banner. |

