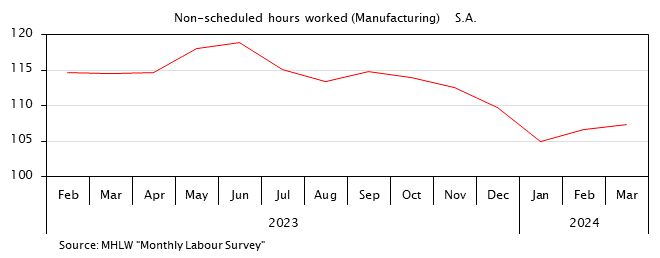
Non-scheduled Hours Worked
| Non-scheduled hours worked | |||||||
|---|---|---|---|---|---|---|---|
| Annual percent change |
Manufacturing | ||||||
| Annual percent change |
Indices (2020=100) |
Ratio to the Preceding Month | |||||
| Calendar year | Hours | % | Hours | % | % | ||
| 2018 | 10.8 | -1.5 | 16.4 | 1.5 | 137.7 | - | |
| 2019 | 10.6 | -1.9 | 15.1 | -8.5 | 126.0 | - | |
| 2020 | 9.2 | -13.2 | 11.9 | -20.7 | 100.0 | - | |
| 2021 | 9.7 | 5.1 | 13.6 | 14.1 | 114.0 | - | |
| 2022 | 10.1 | 4.6 | 14.4 | 6.2 | 121.1 | - | |
| 2023 | 10.0 | -0.9 | 13.6 | -5.5 | 114.4 | - | |
| (S.A.) | (S.A.) % | ||||||
| 2023 | Jan | 9.7 | 1.1 | 13.0 | -4.5 | 113.6 | -3.3 |
| Feb | 10.0 | 2.1 | 14.2 | -4.7 | 114.6 | 0.9 | |
| Mar | 10.5 | 1.0 | 14.3 | -5.3 | 114.5 | -0.1 | |
| Apr | 10.5 | -1.9 | 14.0 | -6.1 | 114.6 | 0.1 | |
| May | 9.7 | 0.0 | 12.6 | -2.3 | 118.0 | 3.0 | |
| Jun | 10.0 | 0.0 | 13.4 | -3.6 | 118.9 | 0.8 | |
| Jul | 10.0 | -2.0 | 13.5 | -6.9 | 115.1 | -3.2 | |
| Aug | 9.3 | -1.1 | 12.7 | -7.3 | 113.4 | -1.5 | |
| Sep | 9.9 | -3.0 | 13.6 | -6.2 | 114.8 | 1.2 | |
| Oct | 10.3 | -1.8 | 14.0 | -6.1 | 113.9 | -0.8 | |
| Nov | 10.3 | -1.8 | 14.2 | -6.0 | 112.5 | -1.2 | |
| Dec | 10.1 | -3.8 | 13.9 | -6.7 | 109.7 | -2.5 | |
| 2024 | Jan | 9.6 | -4.0 | 12.1 | -7.6 | 104.9 | -4.4 |
| Feb | r 10.1 | r -2.0 | r 13.3 | r -7.0 | r 106.7 | r 1.7 | |
| Source | MHLW "Monthly Labour Survey" | ||||||
- NOTES:
- 5 or more regular employees.


