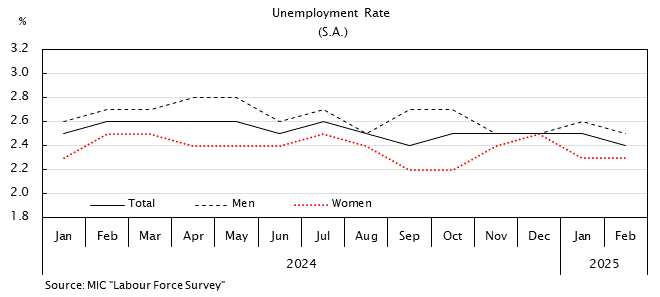
Unemployment and Employment Insurance
| Unemployed | Unemployment rate | Beneficiaries receiving benefits |
||||
|---|---|---|---|---|---|---|
| Men | Women | Annual percent change | ||||
| Calendar year | 10thous. | % | % | % | % | |
| 2019 | 162 | 2.4 | 2.5 | 2.2 | 3.3 | |
| 2020 | 192 | 2.8 | 3.0 | 2.5 | 22.8 | |
| 2021 | 195 | 2.8 | 3.1 | 2.5 | -8.7 | |
| 2022 | 179 | 2.6 | 2.8 | 2.4 | -6.7 | |
| 2023 | 178 | 2.6 | 2.8 | 2.3 | 4.4 | |
| 2024 | 176 | 2.5 | 2.7 | 2.4 | 1.0 | |
| (S.A.) 10thous. | (S.A.) % | (S.A.) % | (S.A.) % | % | ||
| 2024 | Oct | 172 | 2.5 | 2.7 | 2.2 | -0.5 |
| Nov | 173 | 2.5 | 2.5 | 2.4 | -2.7 | |
| Dec | 172 | 2.5 | 2.5 | 2.5 | 2.0 | |
| 2025 | Jan | 174 | 2.5 | 2.6 | 2.3 | 0.8 |
| Feb | 168 | 2.4 | 2.5 | 2.3 | -0.7 | |
| Mar | 173 | 2.5 | 2.7 | 2.2 | 0.9 | |
| Apr | 176 | 2.5 | 2.7 | 2.3 | -2.5 | |
| May | 172 | 2.5 | 2.6 | 2.3 | -2.3 | |
| Jun | 172 | 2.5 | 2.5 | 2.4 | 5.4 | |
| Jul | 164 | 2.3 | 2.5 | 2.2 | 7.2 | |
| Aug | 179 | 2.6 | 2.8 | 2.3 | 8.5 | |
| Sep | 181 | 2.6 | 2.7 | 2.4 | 13.9 | |
| Oct | 185 | 2.6 | 2.8 | 2.4 | 11.8 | |
| Nov | 181 | 2.6 | 2.9 | 2.2 | 9.3 | |
| Source | MIC "Labour Force Survey" | MHLW "Employment Insurance Statistics" |
||||


