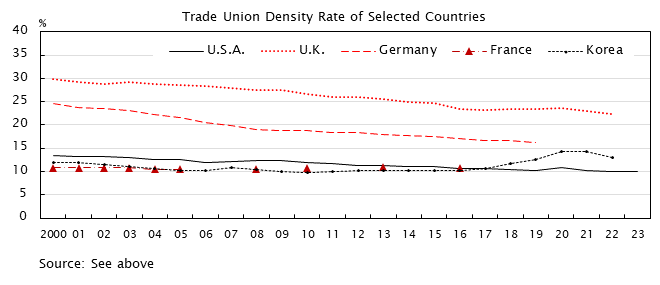
Trade Union Density Rate of Selected Countries
| Trade Union Density Rate | |||||
|---|---|---|---|---|---|
| U.S.A. | Germany | U.K. | France | Korea | |
| Calendar year | % | % | % | % | % |
| 2000 | 13.4 | 24.6 | 29.8 | 10.8 | 12.0 |
| 2001 | 13.3 | 23.7 | 29.3 | 10.8 | 12.0 |
| 2002 | 13.3 | 23.5 | 28.8 | 10.8 | 11.6 |
| 2003 | 12.9 | 23.0 | 29.3 | 10.8 | 11.0 |
| 2004 | 12.5 | 22.2 | 28.8 | 10.5 | 10.6 |
| 2005 | 12.5 | 21.5 | 28.6 | 10.5 | 10.3 |
| 2006 | 12.0 | 20.6 | 28.3 | 10.3 | |
| 2007 | 12.1 | 19.8 | 28.0 | 10.8 | |
| 2008 | 12.4 | 19.0 | 27.5 | 10.6 | 10.5 |
| 2009 | 12.3 | 18.8 | 27.4 | 10.1 | |
| 2010 | 11.9 | 18.9 | 26.6 | 10.8 | 9.8 |
| 2011 | 11.8 | 18.4 | 26.0 | 10.1 | |
| 2012 | 11.3 | 18.3 | 26.1 | 10.3 | |
| 2013 | 11.3 | 18.0 | 25.6 | 11.0 | 10.3 |
| 2014 | 11.1 | 17.7 | 25.0 | 10.3 | |
| 2015 | 11.1 | 17.6 | 24.7 | 10.2 | |
| 2016 | 10.7 | 17.0 | 23.5 | 10.8 | 10.3 |
| 2017 | 10.7 | 16.7 | 23.3 | 10.7 | |
| 2018 | 10.5 | 16.6 | 23.4 | 11.8 | |
| 2019 | 10.3 | 16.3 | 23.5 | 12.5 | |
| 2020 | 10.8 | 23.7 | 14.2 | ||
| 2021 | 10.3 | 23.1 | 14.2 | ||
| 2022 | 10.1 | 22.3 | 13.1 | ||
| 2023 | 10.0 | ||||
| Source | USA "Union Membership 2022(Bureau of Labor Statistics)" UK "Trade Union Membership 2022(Dept. for Business, Innovation and Skills)" Germany,France "Trade Union Density in OECD countries(OECD)" KOREA (Ministry of Employment and Labor) |
||||


