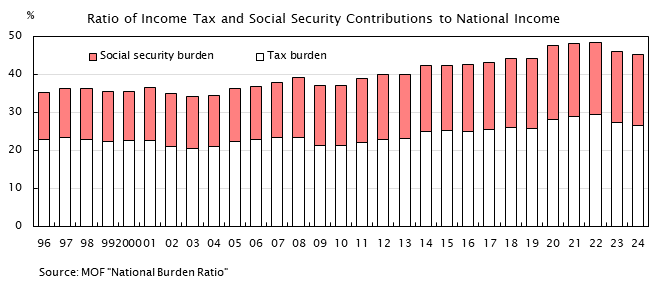
Ratio of Income Tax and Social Security Contributions to National Income
| Ratio of income tax and social security contributions to national income |
Tax burden | Social security burden | |
|---|---|---|---|
| Fiscal year | % | % | % |
| 1996 | 35.2 | 22.9 | 12.3 |
| 1997 | 36.3 | 23.5 | 12.8 |
| 1998 | 36.2 | 23.0 | 13.2 |
| 1999 | 35.4 | 22.3 | 13.1 |
| 2000 | 35.6 | 22.6 | 13.0 |
| 2001 | 36.5 | 22.7 | 13.8 |
| 2002 | 35.0 | 21.2 | 13.9 |
| 2003 | 34.1 | 20.5 | 13.6 |
| 2004 | 34.5 | 21.0 | 13.5 |
| 2005 | 36.2 | 22.4 | 13.8 |
| 2006 | 37.0 | 22.9 | 14.0 |
| 2007 | 37.9 | 23.5 | 14.4 |
| 2008 | 39.2 | 23.4 | 15.8 |
| 2009 | 37.2 | 21.4 | 15.8 |
| 2010 | 37.2 | 21.4 | 15.8 |
| 2011 | 38.8 | 22.2 | 16.6 |
| 2012 | 39.8 | 22.8 | 17.1 |
| 2013 | 40.1 | 23.2 | 16.8 |
| 2014 | 42.4 | 25.1 | 17.2 |
| 2015 | 42.3 | 25.2 | 17.1 |
| 2016 | 42.7 | 25.1 | 17.6 |
| 2017 | 43.3 | 25.5 | 17.7 |
| 2018 | 44.2 | 26.0 | 18.1 |
| 2019 | 44.2 | 25.7 | 18.5 |
| 2020 | 47.7 | 28.1 | 19.6 |
| 2021 | 48.1 | 28.9 | 19.2 |
| 2022 | 48.4 | 29.4 | 19.0 |
| 2023 | 46.1 | 27.5 | 18.6 |
| 2024 | 45.1 | 26.7 | 18.4 |
| Source | MOF "National Burden Ratio" | ||
- NOTES:
- 2022,2023=Forecast


