Family Income and Expenditure - Consumption Expenditures
| Two-or-more-person Households | ||||||
|---|---|---|---|---|---|---|
| Workers' households | All households | |||||
| Consumption expenditures |
Average propensity to consume |
Consumption expenditures |
||||
| Annual percent change (Nominal) | Annual percent change (Real) | Annual percent change (Real) | ||||
| Calendar year | ¥ | % | % | % | % | |
| 2018 | 315,314 | -0.3 | -1.5 | 69.3 | -0.4 | |
| 2019 | 323,853 | 1.8 | 1.2 | 67.9 | 0.9 | |
| 2020 | 305,811 | -5.6 | -5.6 | 61.3 | -5.3 | |
| 2021 | 309,469 | 1.2 | 1.5 | 62.8 | 0.7 | |
| 2022 | 320,627 | 3.6 | 0.6 | 64.0 | 1.2 | |
| 2023 | 318,755 | -0.6 | -4.2 | 64.4 | -2.6 | |
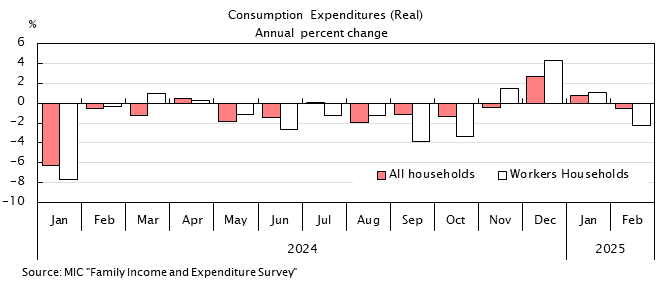
| 2023 | Jan | 331,130 | 5.3 | 0.2 | 81.8 | -0.3 |
| Feb | 298,749 | 4.7 | 0.8 | 64.4 | 1.6 | |
| Mar | 340,016 | -1.1 | -4.7 | 83.5 | -1.9 | |
| Apr | 334,229 | -2.9 | -6.7 | 73.9 | -4.4 | |
| May | 311,830 | -1.0 | -4.6 | 90.2 | -4.0 | |
| Jun | 298,405 | -0.7 | -4.4 | 41.1 | -4.2 | |
| Jul | 306,293 | -3.6 | -7.2 | 59.7 | -5.0 | |
| Aug | 311,510 | -3.4 | -6.8 | 69.3 | -2.5 | |
| Sep | 311,728 | -0.7 | -4.2 | 78.2 | -2.8 | |
| Oct | 330,590 | 0.6 | -3.2 | 71.3 | -2.5 | |
| Nov | 301,718 | -2.1 | -5.2 | 74.7 | -2.9 | |
| Dec | 348,859 | -1.4 | -4.3 | 38.4 | -2.5 | |
| 2024 | Jan | 313,165 | -5.4 | -7.7 | 76.7 | -6.3 |
| Feb | 307,765 | 3.0 | -0.3 | 66.1 | -0.5 | |
| Source | MIC "Family Income and Expenditure Survey" | |||||
- NOTES:
- "Annual percent change" of 2018 and 2019 are discontinuity-adjusted figures.