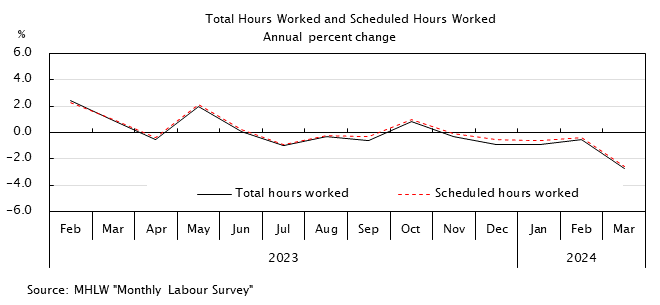
Total Hours Worked and Scheduled Hours Worked
| 5 or more regular employees | |||||
|---|---|---|---|---|---|
| Total hours worked | Scheduled hours worked | ||||
| Annual percent change | Annual percent change | ||||
| Calendar year | Hours | % | Hours | % | |
| 2018 | 142.2 | -0.8 | 131.4 | -0.8 | |
| 2019 | 139.1 | -2.2 | 128.5 | -2.2 | |
| 2020 | 135.1 | -2.8 | 125.9 | -2.0 | |
| 2021 | 136.1 | 0.6 | 126.4 | 0.4 | |
| 2022 | 136.1 | 0.1 | 126.0 | -0.3 | |
| 2023 | 136.3 | 0.1 | 126.3 | 0.2 | |
| 2023 | Jan | 128.0 | -1.1 | 118.3 | -1.3 |
| Feb | 133.3 | 2.4 | 123.3 | 2.3 | |
| Mar | 138.0 | 0.9 | 127.5 | 1.0 | |
| Apr | 140.8 | -0.5 | 130.3 | -0.4 | |
| May | 133.6 | 2.0 | 123.9 | 2.1 | |
| Jun | 142.4 | 0.1 | 132.4 | 0.2 | |
| Jul | 138.6 | -1.0 | 128.6 | -0.9 | |
| Aug | 131.8 | -0.3 | 122.5 | -0.2 | |
| Sep | 136.5 | -0.6 | 126.6 | -0.3 | |
| Oct | 138.3 | 0.8 | 128.0 | 1.0 | |
| Nov | 138.3 | -0.3 | 128.0 | -0.1 | |
| Dec | 136.1 | -0.9 | 126.0 | -0.5 | |
| 2024 | Jan | 128.7 | -0.9 | 119.1 | -0.6 |
| Feb | r 134.6 | r -0.5 | r 124.5 | r -0.4 | |
| Source | MHLW "Monthly Labour Survey" | ||||
- NOTES:
- 5 or more regular employees.


