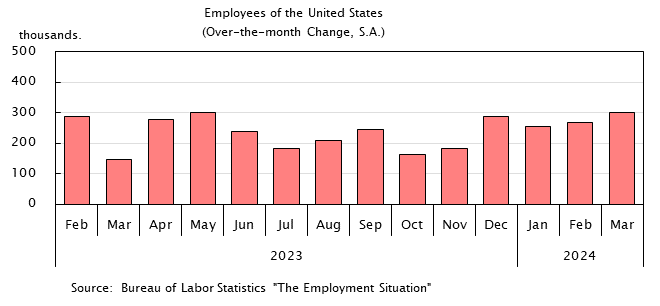
Employees of Selected Countries
| Employees | ||||||
|---|---|---|---|---|---|---|
| U.S.A. | U.K. | Germany | France | |||
| Over-the-month Change |
||||||
| Calendar year | thous. | thous. | thous. | thous. | thous. | |
| 2018 | 148,908 | 2,301 | 27,494 | 36,986 | 23,658 | |
| 2019 | 150,904 | 1,996 | 27,652 | 37,477 | 23,616 | |
| 2020 | 142,186 | -8,718 | 27,752 | 36,865 | 23,405 | |
| 2021 | 146,285 | 4,099 | 28,023 | 36,818 | 23,953 | |
| 2022 | 152,520 | 6,235 | 28,447 | 37,798 | 24,331 | |
| 2023 | 156,051 | 3,531 | 28,666 | |||
| (S.A.) | (S.A.) | (S.A.) | ||||
| 2023 | Jan | 154,773 | 482 | |||
| Feb | 155,060 | 287 | ||||
| Mar | 155,206 | 146 | 28,666 | 38,437 | 24,428 | |
| Apr | 155,484 | 278 | ||||
| May | 155,787 | 303 | ||||
| Jun | 156,027 | 240 | 28,688 | 38,272 | 24,593 | |
| Jul | 156,211 | 184 | ||||
| Aug | 156,421 | 210 | ||||
| Sep | 156,667 | 246 | 28,633 | 38,293 | 24,645 | |
| Oct | 156,832 | 165 | ||||
| Nov | 157,014 | 182 | ||||
| Dec | 157,304 | 290 | 28,678 | 38,508 | 24,504 | |
| 2024 | Jan | p 157,533 | p 229 | |||
| Feb | p 157,808 | p 275 | ||||
| Source | U.S.A. Bureau of Labor Statistics "The Employment Situation" Germany, France Eurostat "Eurostat Database" U.K. Office for National Statistics "Lanbour Market Statistics" |
|||||
- NOTES:
- U.S.A : Total nonfarm
Germany, U.K., France : The figure for the quarter, from 15 to 64 years(U.K. : All aged 16 and over)


