
Recent Statistical Survey Reports, January 2018
Statistical Survey Reports
Monthly Labour Survey (Provisional Report in November)
January 9, released by the Ministry of Health, Labour and Welfare
Total amount of cash earnings increased by 0.9% and contractual cash earnings increased by 0.6% (full-time employees 0.3%, part-time employees 0.0%) from a year earlier.
Special cash earnings increased by 7.5% from a year earlier. Scheduled cash earnings increased by 0.4% and non-scheduled cash earnings increased by 2.6%. Real wage (total cash earnings) increased by 0.1% from a year earlier and real wage (contractual cash earnings) decreased by 0.1% from a year earlier.
Non-scheduled hours worked by manufacturing industry workers at business establishments with 5 or more employees increased by 0.2% from the previous month (seasonally adjusted).
Survey on Public Assistance Recipients (October)
Survey on Public Assistance Recipients (October)
The number of welfare recipients in October was 2,125,317 and the number of households of welfare recipients was 1,642,907.
Indexes of Business Conditions November 2017 (Preliminary Release)
January 11, released by the Cabinet Office
The Coincident Index of Composite Index (CI, revised figures, 2010=100) in November was 118.1, an increase of 1.7 point. And 3 months backward moving average increased by for 0.17point, and 7 months backward moving average increased for 0.20point. So the Assessment of Coincident Index was “Improving” (The same as the previous month)
The Leading Index was 108.6, an increase of 2.1 point, and the Lagging Index was 118.7, an increase of 0.2 point.
Survey on Situation of Preliminary Job Offers for New Graduate (Senior and Junior High School) (End of November, 2017)
January 17, released by the Ministry of Health, Labour and Welfare
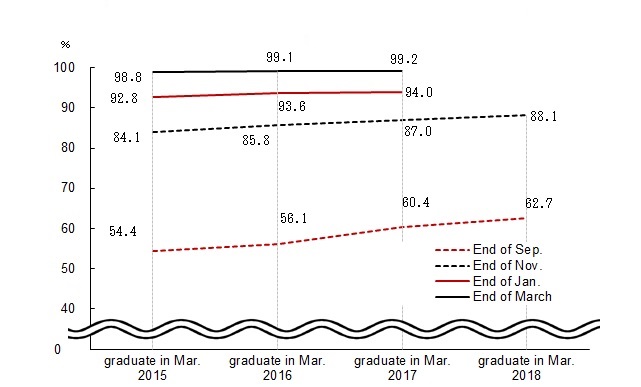
The ratio of final-year senior high school students with preliminary job offers was 88.1%, an increase of 1.1 point from the same period of the previous year.
The ratio of job openings to applicants for final-year senior high school students was 2.44, 0.31 point higher than the same period of the previous year.
The ratio of job openings to applicants for final-year junior high school students was 1.49, 0.18 point higher than the same period of the previous year.
Trend in the percentage of final-year high school students
with official job offer
Survey on Situation of Preliminary Job Offers for New Graduate in Mar.2018 (University, etc.) (December 1, 2017)
January 17, released by the Ministry of Health, Labour and Welfare and the Ministry of Education, Culture, Sports, Science and Technology
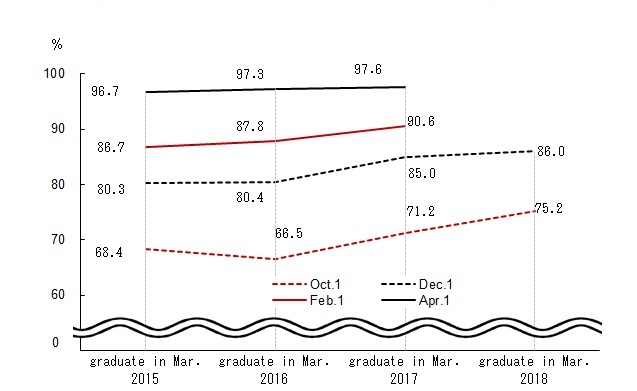
The ratio of final-year university students who got an official job offer to applicants was 86.0%, increased by 1.0 point from the same period a year earlier.
Trend in the percentage of final-year university students
with official job offer
The Result of Year–end Bonus Negotiations among Major Private Enterprises (2017)
January 19, released by the Ministry of Health, Labour and Welfare
The amount of agreed year-end bonus of 359 major business establishments with the capital one billion yen or more and the labour union belonged by 1,000 employees or more was 830,625 yen, an increase of 16 yen (0.00%) from a year earlier.
Monthly Labour Survey (Final Report in November)
January 23, released by the Ministry of Health, Labour and Welfare![]()
Total amount of cash earnings increased by 0.9% and contractual cash earnings increased by 0.4% (full-time employees 0.4%, part-time employees 0.8%) from a year earlier.
Special cash earnings increased by 7.9% from a year earlier. Scheduled cash earnings increased by 0.3% and non-scheduled cash earnings increased by 1.9%. Real wage (total cash earnings) increased by 0.1% and real wage (contractual cash earnings) decreased by 0.3%.
Non-scheduled hours worked by manufacturing industry workers at business establishments with 5 or more employees increased by 0.2% from the previous month (seasonally adjusted).
Indexes of Business Conditions November 2017 (Revision of the Preliminary Release)
January 24, released by the Cabinet Office
The Coincident Index of Composite Index (CI, revised figures, 2010=100) in November was 117.9, an increase of 1.5 point. And 3 months backward moving average increased for 0.10 point, and 7 months backward moving average increased for 0.17 point. So the Assessment of Coincident Index was “Improving” (The same as the previous month)
The Leading Index was 108.3, increased by 1.8%, and the Lagging Index was 118.8, an increase of 0.2 point.
Survey on Supply and Demand of Construction Labor
January 25, released by the Ministry of Land, Infrastructure, Transport and Tourism
Consumer Price Index (December and 2017)
January 26, released by the Ministry of Internal Affairs and Communications
The consumer price index for Japan in December 2017 was 101.2(2015=100), up 1.0% over the year. All items, less fresh food, the comprehensive index was 100.7, up 0.9% from the previous year. All items, less fresh food and energy, the comprehensive index was 101.0, up 0.3% from the previous year.
The consumer price index for Japan in 2017 was 100.4(2015=100), up 0.5% over the year. All items, less fresh food, the comprehensive index was 100.2, up 0.5% from the previous year. All items, less fresh food and energy, the comprehensive index was 100.7, up 0.1% from the previous year.
The consumer price index for Ku-area of Tokyo in January 2018(preliminary) was 100.8(2015=100), up 1.3% from the previous year. All items, less fresh food, the comprehensive index was 99.8, up 0.7% from the previous year. All items, less fresh food and energy, the comprehensive index was 100.3, up 0.4% from the previous year.
Report on Situation of Foreign Employees (End of October 2017)
January 26, released by the Ministry of Health, Labour and Welfare
The number of foreign employees was 1,278,670 (an increase of 18.0% from the previous year) as of end of October 2017 and the number of business establishments hired foreign employees was 194,595 (an increase of 12.6% from the previous year).
By nationality of the employees, “China” accounted for the highest 29.1%, followed by “Vietnam” (18.8%), “Philippines” (11.5%) and so on.
Labour Force Survey (December and 2017)
January 30, released by the Ministry of Internal Affairs and Communications
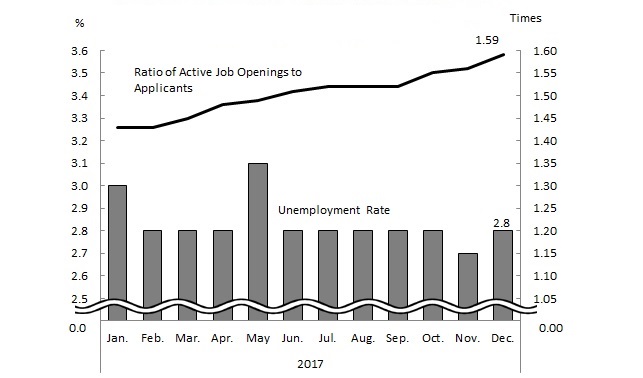
The unemployment rate (seasonally adjusted) was 2.8%, increased by 0.1point from the previous month. That for men was 2.8%, decreased by 0.1 point and that for women was 2.7%, increased by 0.2 point from the previous month.
The number of unemployed persons (seasonally adjusted) was 1.86million, increased by 10 thousand from the previous month.
The number of employees was 58.63 million, increased by 430 thousand from the previous year.
Among them, the number of regular employee was 34.41 million, increased by 500 thousand from the previous year and the number of non-regular employee was 20.81 million, increased by 90 thousand from the previous year.
The average unemployment rate in 2017 was 2.8%, decreased by 0.3 point from the previous year.
The average number of unemployed persons in 2017 was 1.90million, decreased by 180 thousand from the previous year.
The average number of employees in 2017 was 58.19 million, increased by 690 thousand from the previous year. Among them, the number of regular employee was 34.32 million, increased by 560 thousand from the previous year and the number of non-regular employee was 20.36 million, increased by 130 thousand from the previous year.
Employment Referrals for General Workers (December and 2017)
January 30, released by the Ministry of Health, Labour and Welfare![]()
Active job openings-to-applicants ratio (seasonally adjusted) was 1.59, increased by 0.03 point from the previous month.
The number of monthly active job openings (person(s)) (seasonally adjusted) was increased by 1.8% from the previous month and the number of monthly active applications (person(s)) (seasonally adjusted) was decreased by 0.2% from the previous month.
New job openings-to-applicants ratio (seasonally adjusted) was 2.42, increased by 0.05point from the previous month.
Active job openings-to-applicants ratio for regular staff (seasonally adjusted) was 1.07, increased by 0.02point from the previous month.
The average ratio of active job openings to applicants in 2017 was 1.50, increased by 0.14 point from the previous year.
Trend in Unemployment Rate and Ratio of Active Job
Openings to Applicants (seasonally adjusted)
Family Income and Expenditure Survey (December)
January 30, released by the Ministry of Internal Affairs and Communications
The average monthly income for a worker’s household with 2 or more family members was increased by 0.4% in real terms from the same month a year before.
The change over the year of wages & salaries was 0.6% in real terms from the previous year (household heads: -0.8% in real terms, spouse of household: 11.8% in real terms).
The average of consumption expenditures for a worker’s household with 2 or more family members was down 0.5% in real terms from the previous year.
Indices of Industrial Production (December)
January 31, released by the Ministry of Economy, Trade and Industry![]()
The index of industrial production (seasonally adjusted, 2010=100) increased by 2.7% from the previous month. According to the Survey of Production Forecast in Manufacturing, Production is expected to decrease in January and increase in February.
Other Reports
Monthly Economic Report (January)
January 19, released by the Cabinet Office![]()
The Japanese economy is recovering at a moderate pace. (In the previous month, “The Japanese economy is on a moderate recovery.”)
- Private consumption is in picking up. (In the previous month, “Private consumption is in picking up moderately.”)
- Business investment is increasing moderately. (The same as the previous month)
- Exports are picking up. (The same as the previous month)
- Industrial production is increasing moderately. (The same as the previous month)
- Corporate profits is improving. Firms' judgment on current business conditions is improving. (The same as the previous month)
- The employment situation is improving steadily. (In the previous month, “The employment situation is improving.”)
- Consumer prices are flat. (The same as the previous month)
| To view PDF files, you will need Adobe Acrobat Reader Software installed on your computer.The Adobe Acrobat Reader can be downloaded from this banner. |
